
IMAGE
Figure 1
Image
|
Figure Caption
Figure 1
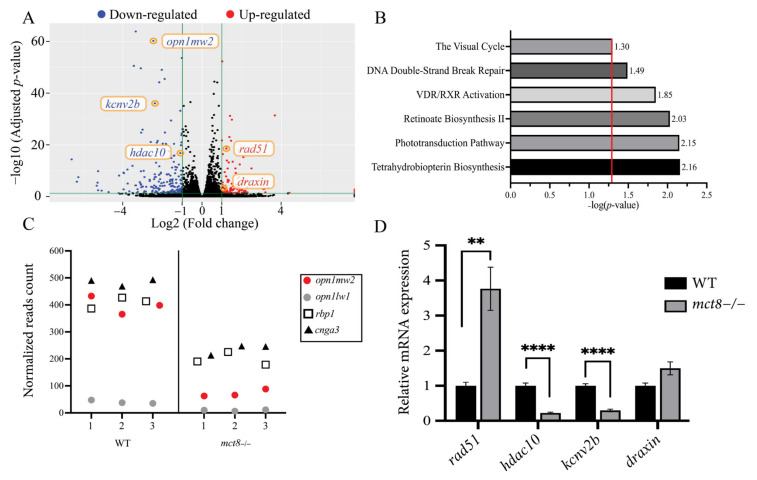
Figure 1. Transcriptome profiling in mct8−/− larvae. (A) Differentially expressed genes in 6 days post-fertilization (dpf) mct8−/− and wild-type (WT) sibling larvae (n = 3 batches for each genotype). Green vertical lines differentiate between significant and insignificant expressed genes. Blue and red dots mark down-regulated and up-regulated genes (1 < log2 [fold change] < 1, adjusted p-value (p-adj) < 0.05), respectively. Black dots mark insignificant expressed genes. Orange circles mark genes validated by qRT-PCR. (B) Representative enriched gene pathways in mct8−/− larvae. The red vertical line marks the threshold of significantly enriched pathways (p-adj ≤ 0.05). (C) Normalized reads count of four differentially expressed genes selected from the enriched vision pathways shown in B. X-axis represents the sample number in each genotype. (D) Relative gene expression of selected genes was quantified using qRT-PCR and normalized against actb (n = 5 batches of larvae for each group). Statistical significance determined by t-test: two-sample. ** p < 0.01, **** p < 0.0001.
Figure Data
Acknowledgments
This image is the copyrighted work of the attributed author or publisher, and
ZFIN has permission only to display this image to its users.
Additional permissions should be obtained from the applicable author or publisher of the image.
Full text @ Int. J. Mol. Sci.