
Image
|
Figure Caption
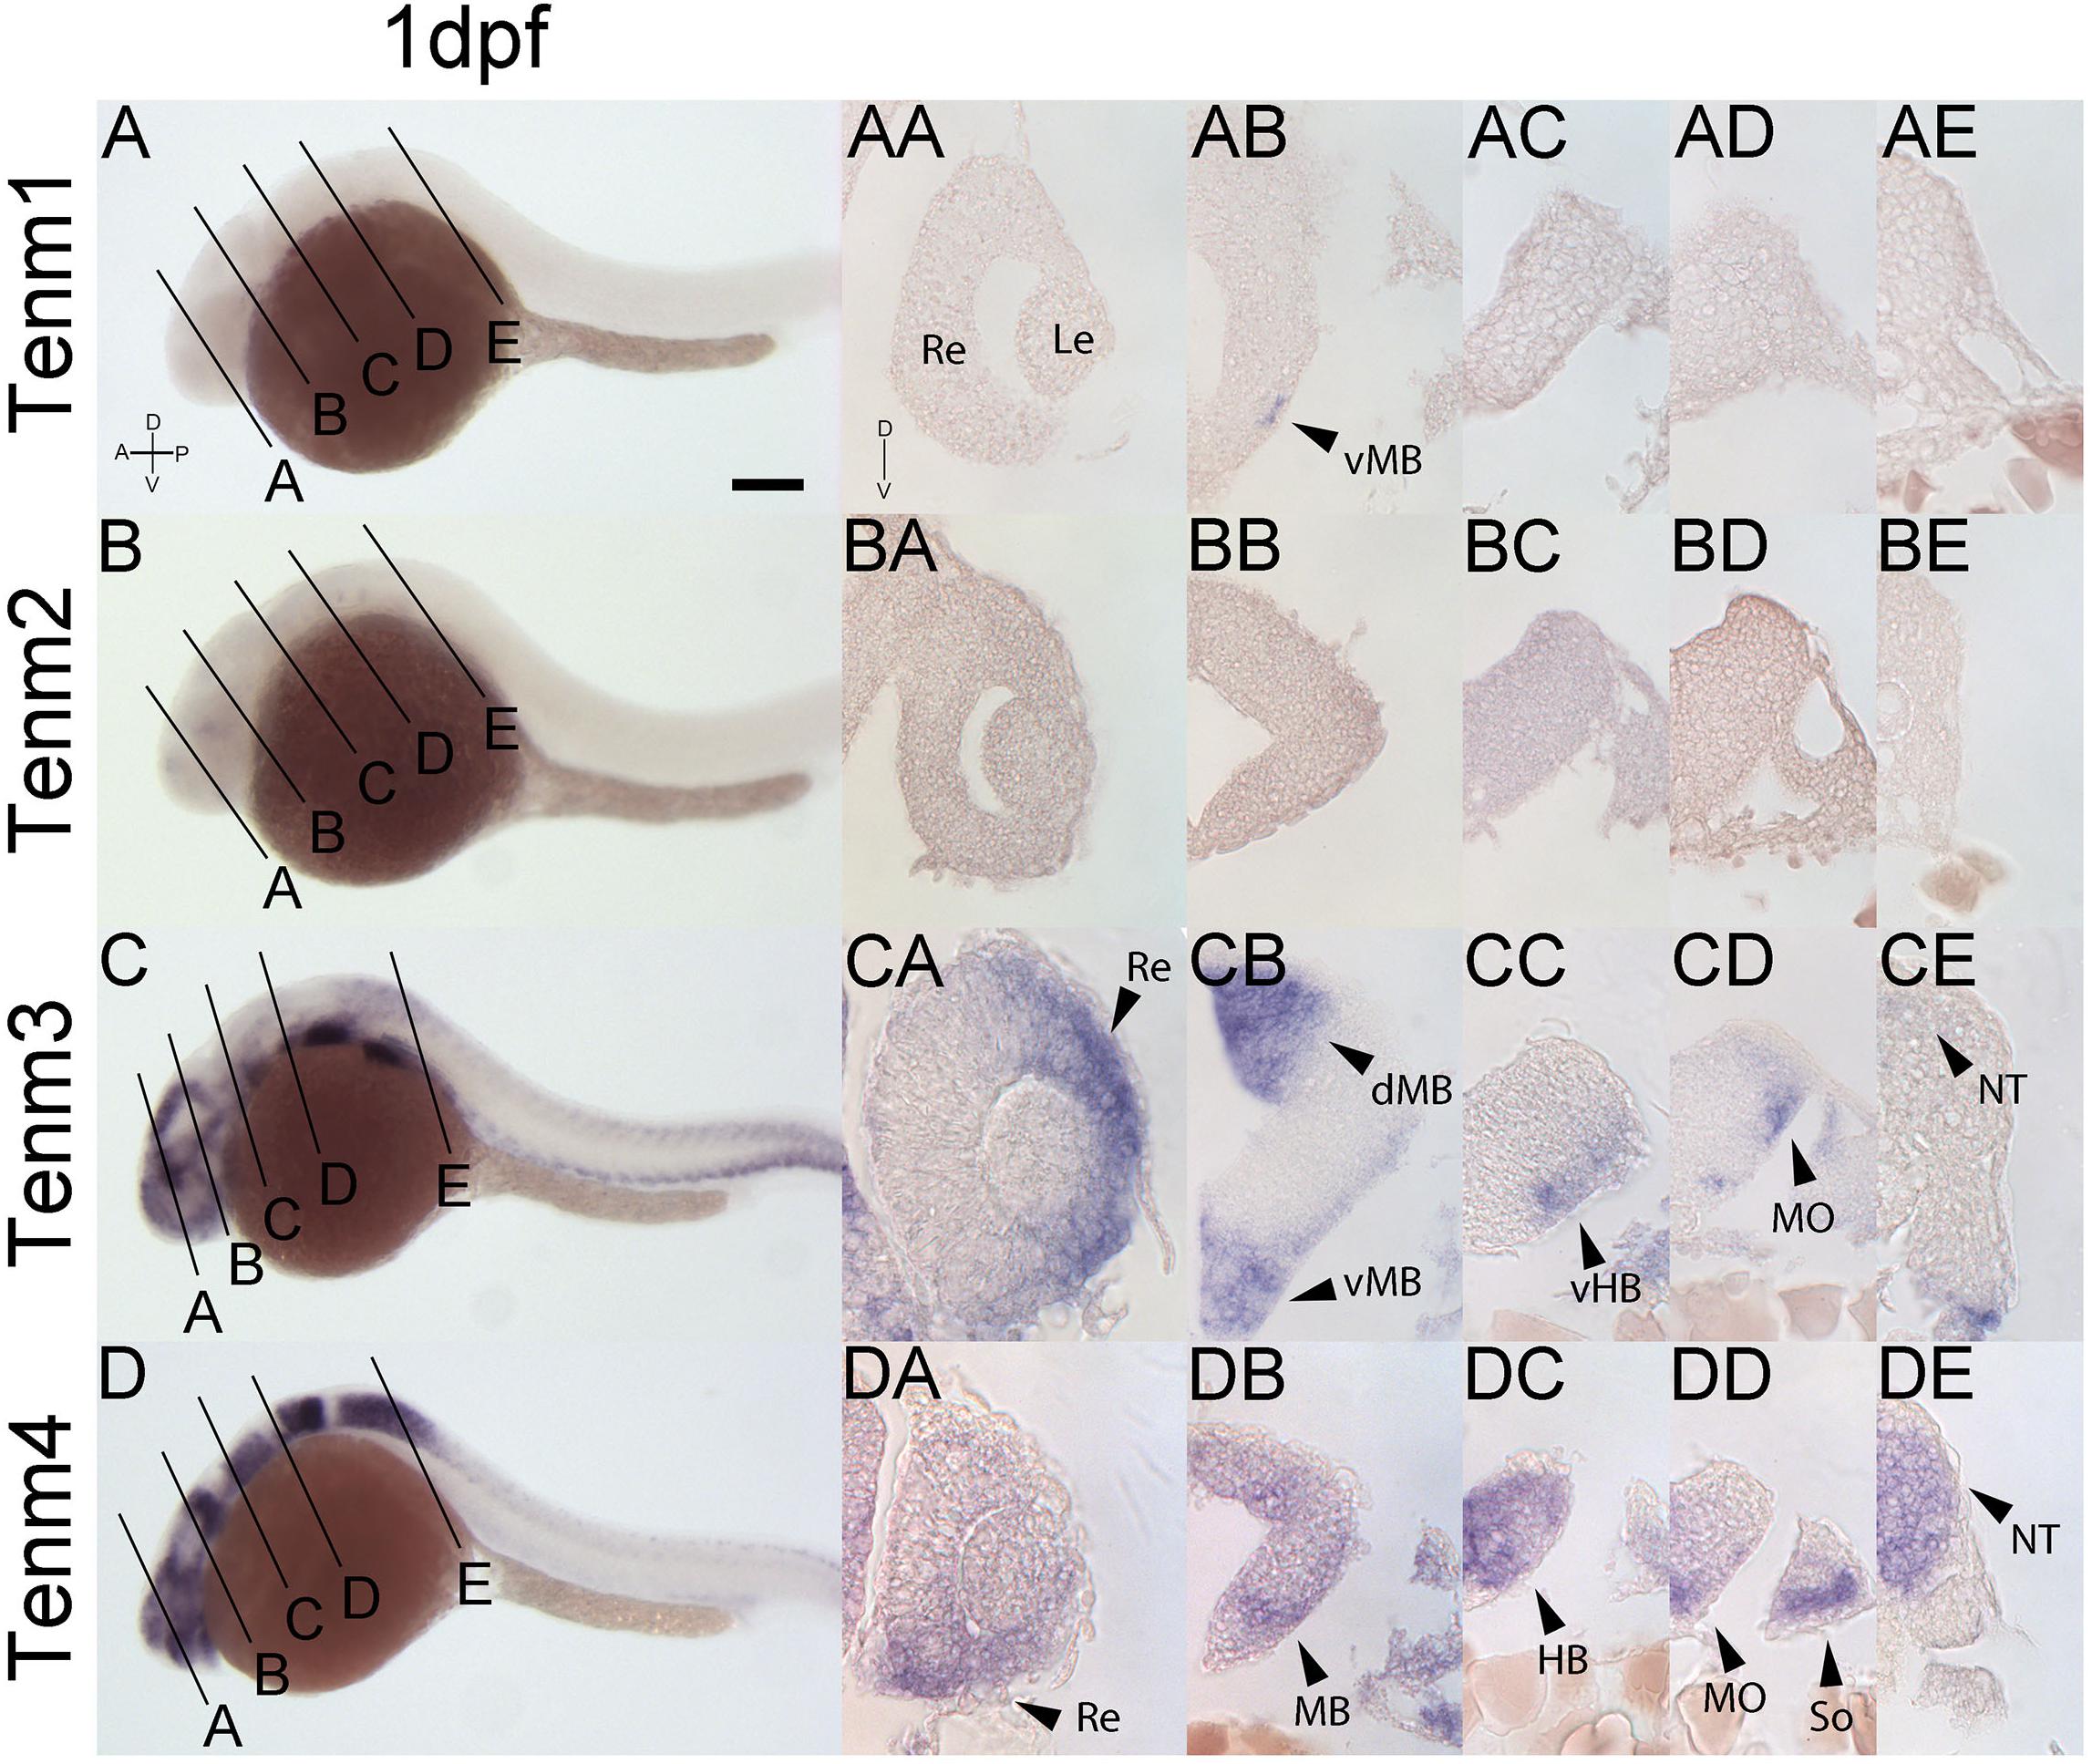
Fig. 6
Comparing tenm1–4 expression at 1 dpf. Transverse sections through the retina (A), midbrain (B), rostral hindbrain (C), caudal hindbrain (D) and spinal cord (E) of 1 dpf zebrafish expressing tenm1–4. A, Anterior; D, Dorsal; dMB, dorsal Midbrain; HB, Hindbrain; Le, Lens; MB, Midbrain; MO, Medulla Oblongata; NT, Neural Tube; P, Posterior; Re, Retina; So, Somites; vMB, ventral Midbrain; V, Ventral; vHB, ventral Hindbrain. Scale bar = 150 μm in A–D; 30 μm in all other panels.
Figure Data
Acknowledgments
This image is the copyrighted work of the attributed author or publisher, and
ZFIN has permission only to display this image to its users.
Additional permissions should be obtained from the applicable author or publisher of the image.
Full text @ Front. Neurosci.