
|
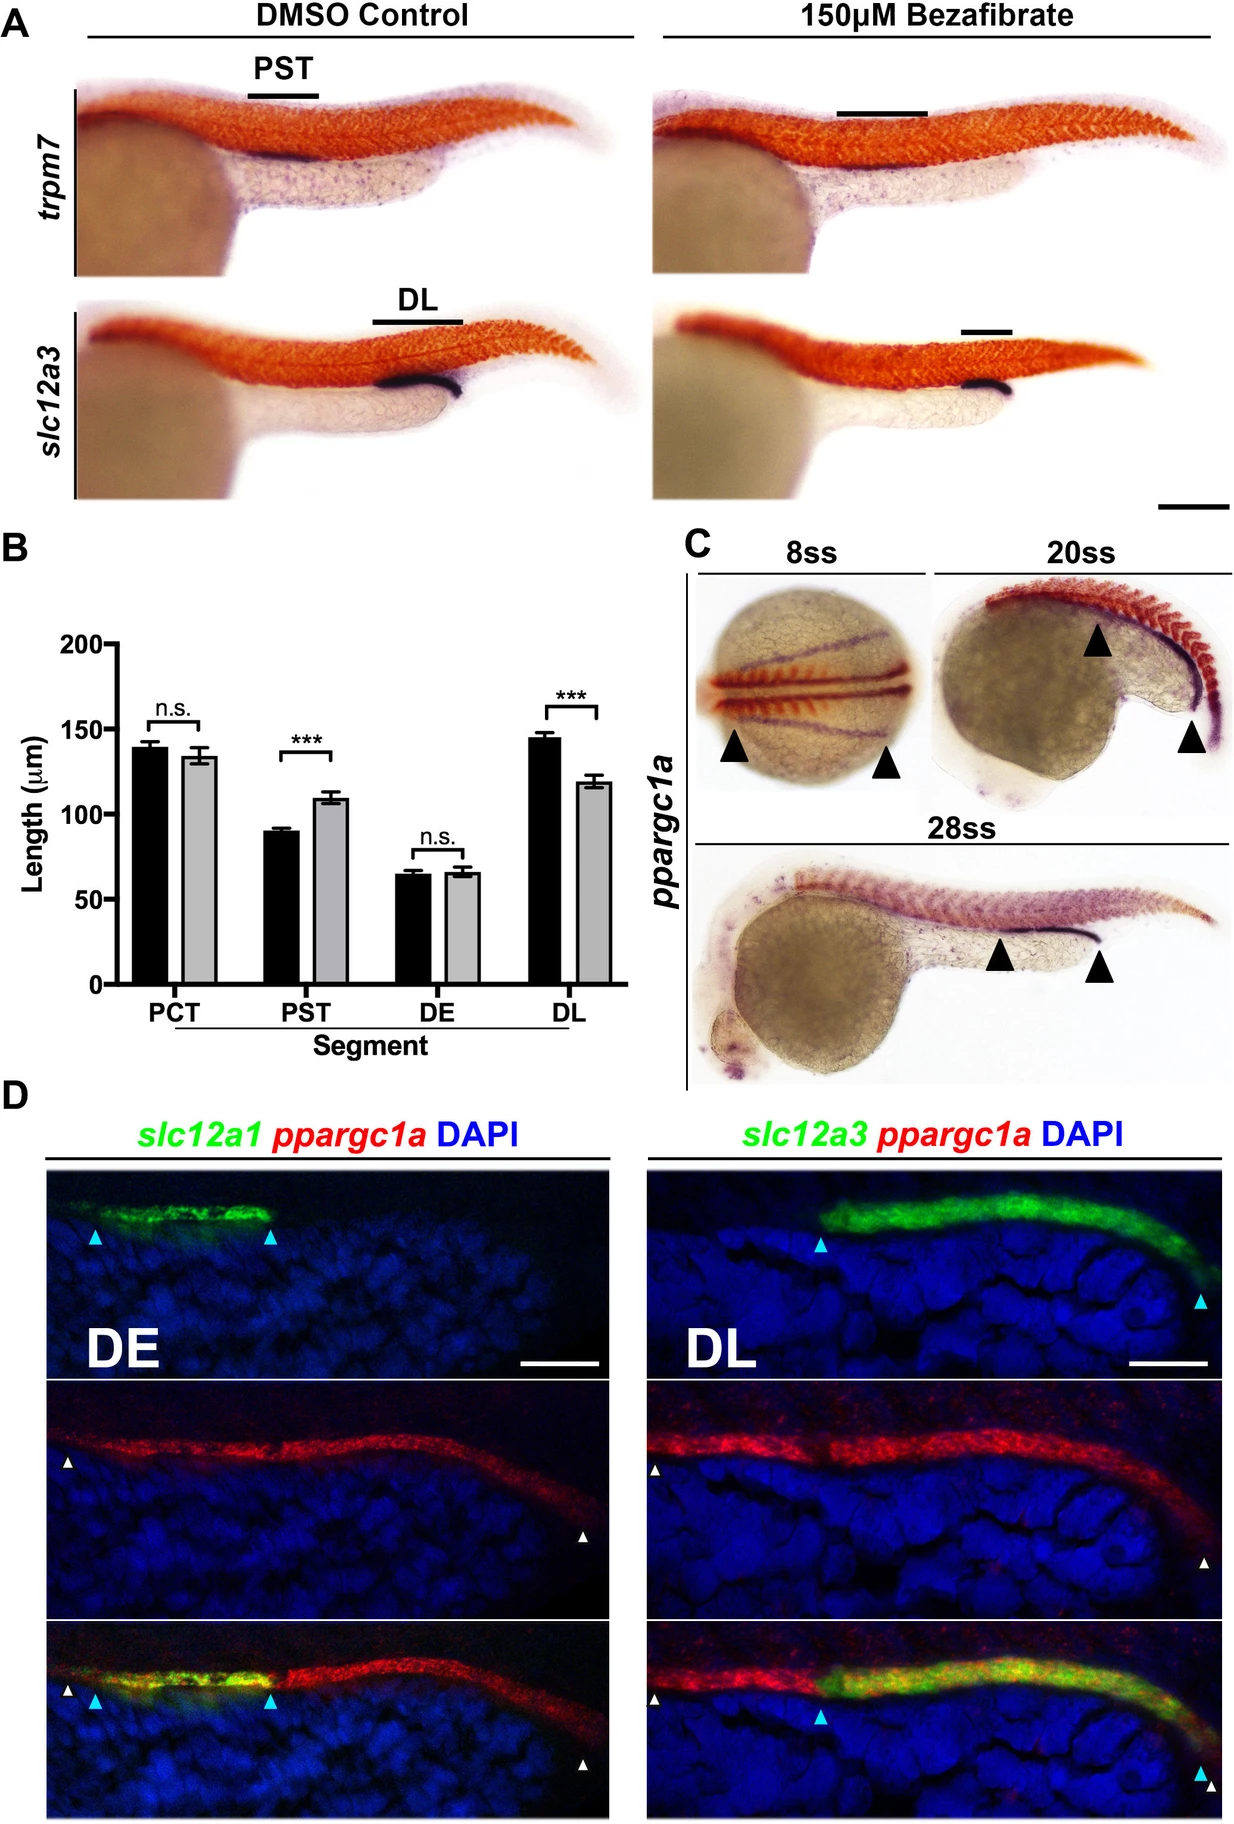
Fig. 1 PPAR agonist bezafibrate alters zebrafish pronephros segmentation, and the PPAR coactivator ppargc1a exhibits a dynamic expression pattern in renal progenitors. (A) Double WISH at the 28 ss for the PST segment marker trpm7 (top), and the DL segment marker slc12a3 (bottom), with smyhc (red) to mark somites in DMSO control (left) and PPAR agonist, 150 μM Bezafibrate-treated (right) samples confirmed the initial hit from the chemical screen. Scale bar = 90 μm. (B) Absolute length measurements of the changes to pronephros segment lengths in bezafibrate treated (grey) and control samples (black). (C) Double WISH for ppargc1a (purple) expression at the 8 ss, 20 ss, and 28 ss with somites stained (red) (8 ss = deltaC, 20 ss and 28 ss = smyhc). (D) Double FISH at the 28 ss showing colocalization of ppargc1a (red) with slc12a1 (distal early, left) and slc12a3 (DL, right). Expression boundaries are indicated with blue (DE, left and DL, right) and white (ppargc1a) arrowheads. Scale bars = 35 μm. Data are represented as ±SD, significant by t test comparing the drug treatment to the DMSO vehicle control, n.s. = not significant, *** = p < 0.001.