
Fig. S2
|
Fig. S2
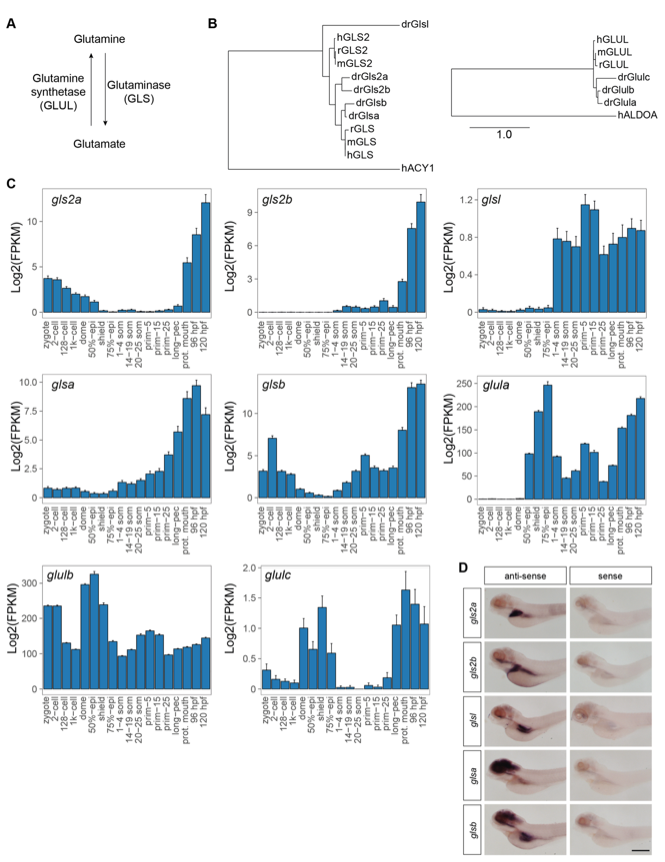
Glutamine metabolism in vertebrates.
(A) Schematic illustrates glutamate metabolism in humans. (B) Phylogenetic analysis of the glutamine synthetase (GLUL) and glutaminase (GLS, GLS2) proteins in human (h), mouse (m), rat (r) and zebrafish (dr). Aminoacylase 1 (ACY1) and aldolase A (ALDOA) were used as outgroups. (C) Reanalysis of a previously published RNA-seq study (1) showing expression of the zebrafish glutaminases (gls2a, gls2b, gls3, glsa, glsb) and glutamine synthetase genes (glula, glulb, glulc) in wild-type embryos/larvae during development. Abbreviations: epi, epiboly; som, somites; prim, primordium; prot, protruding; hpf, hours post-fertilization. (D) Whole-mount in situ hybridization of the glutaminase transcripts (gls2a, gls2b, gls3, glsa, glsb) in wild-type larvae at 120 hpf. Images are a representative example of the whole-mount in situ hybridization stainings (n = 20). Scale-Bar: 0.2 mm.