
Fig. 2
|
Fig. 2
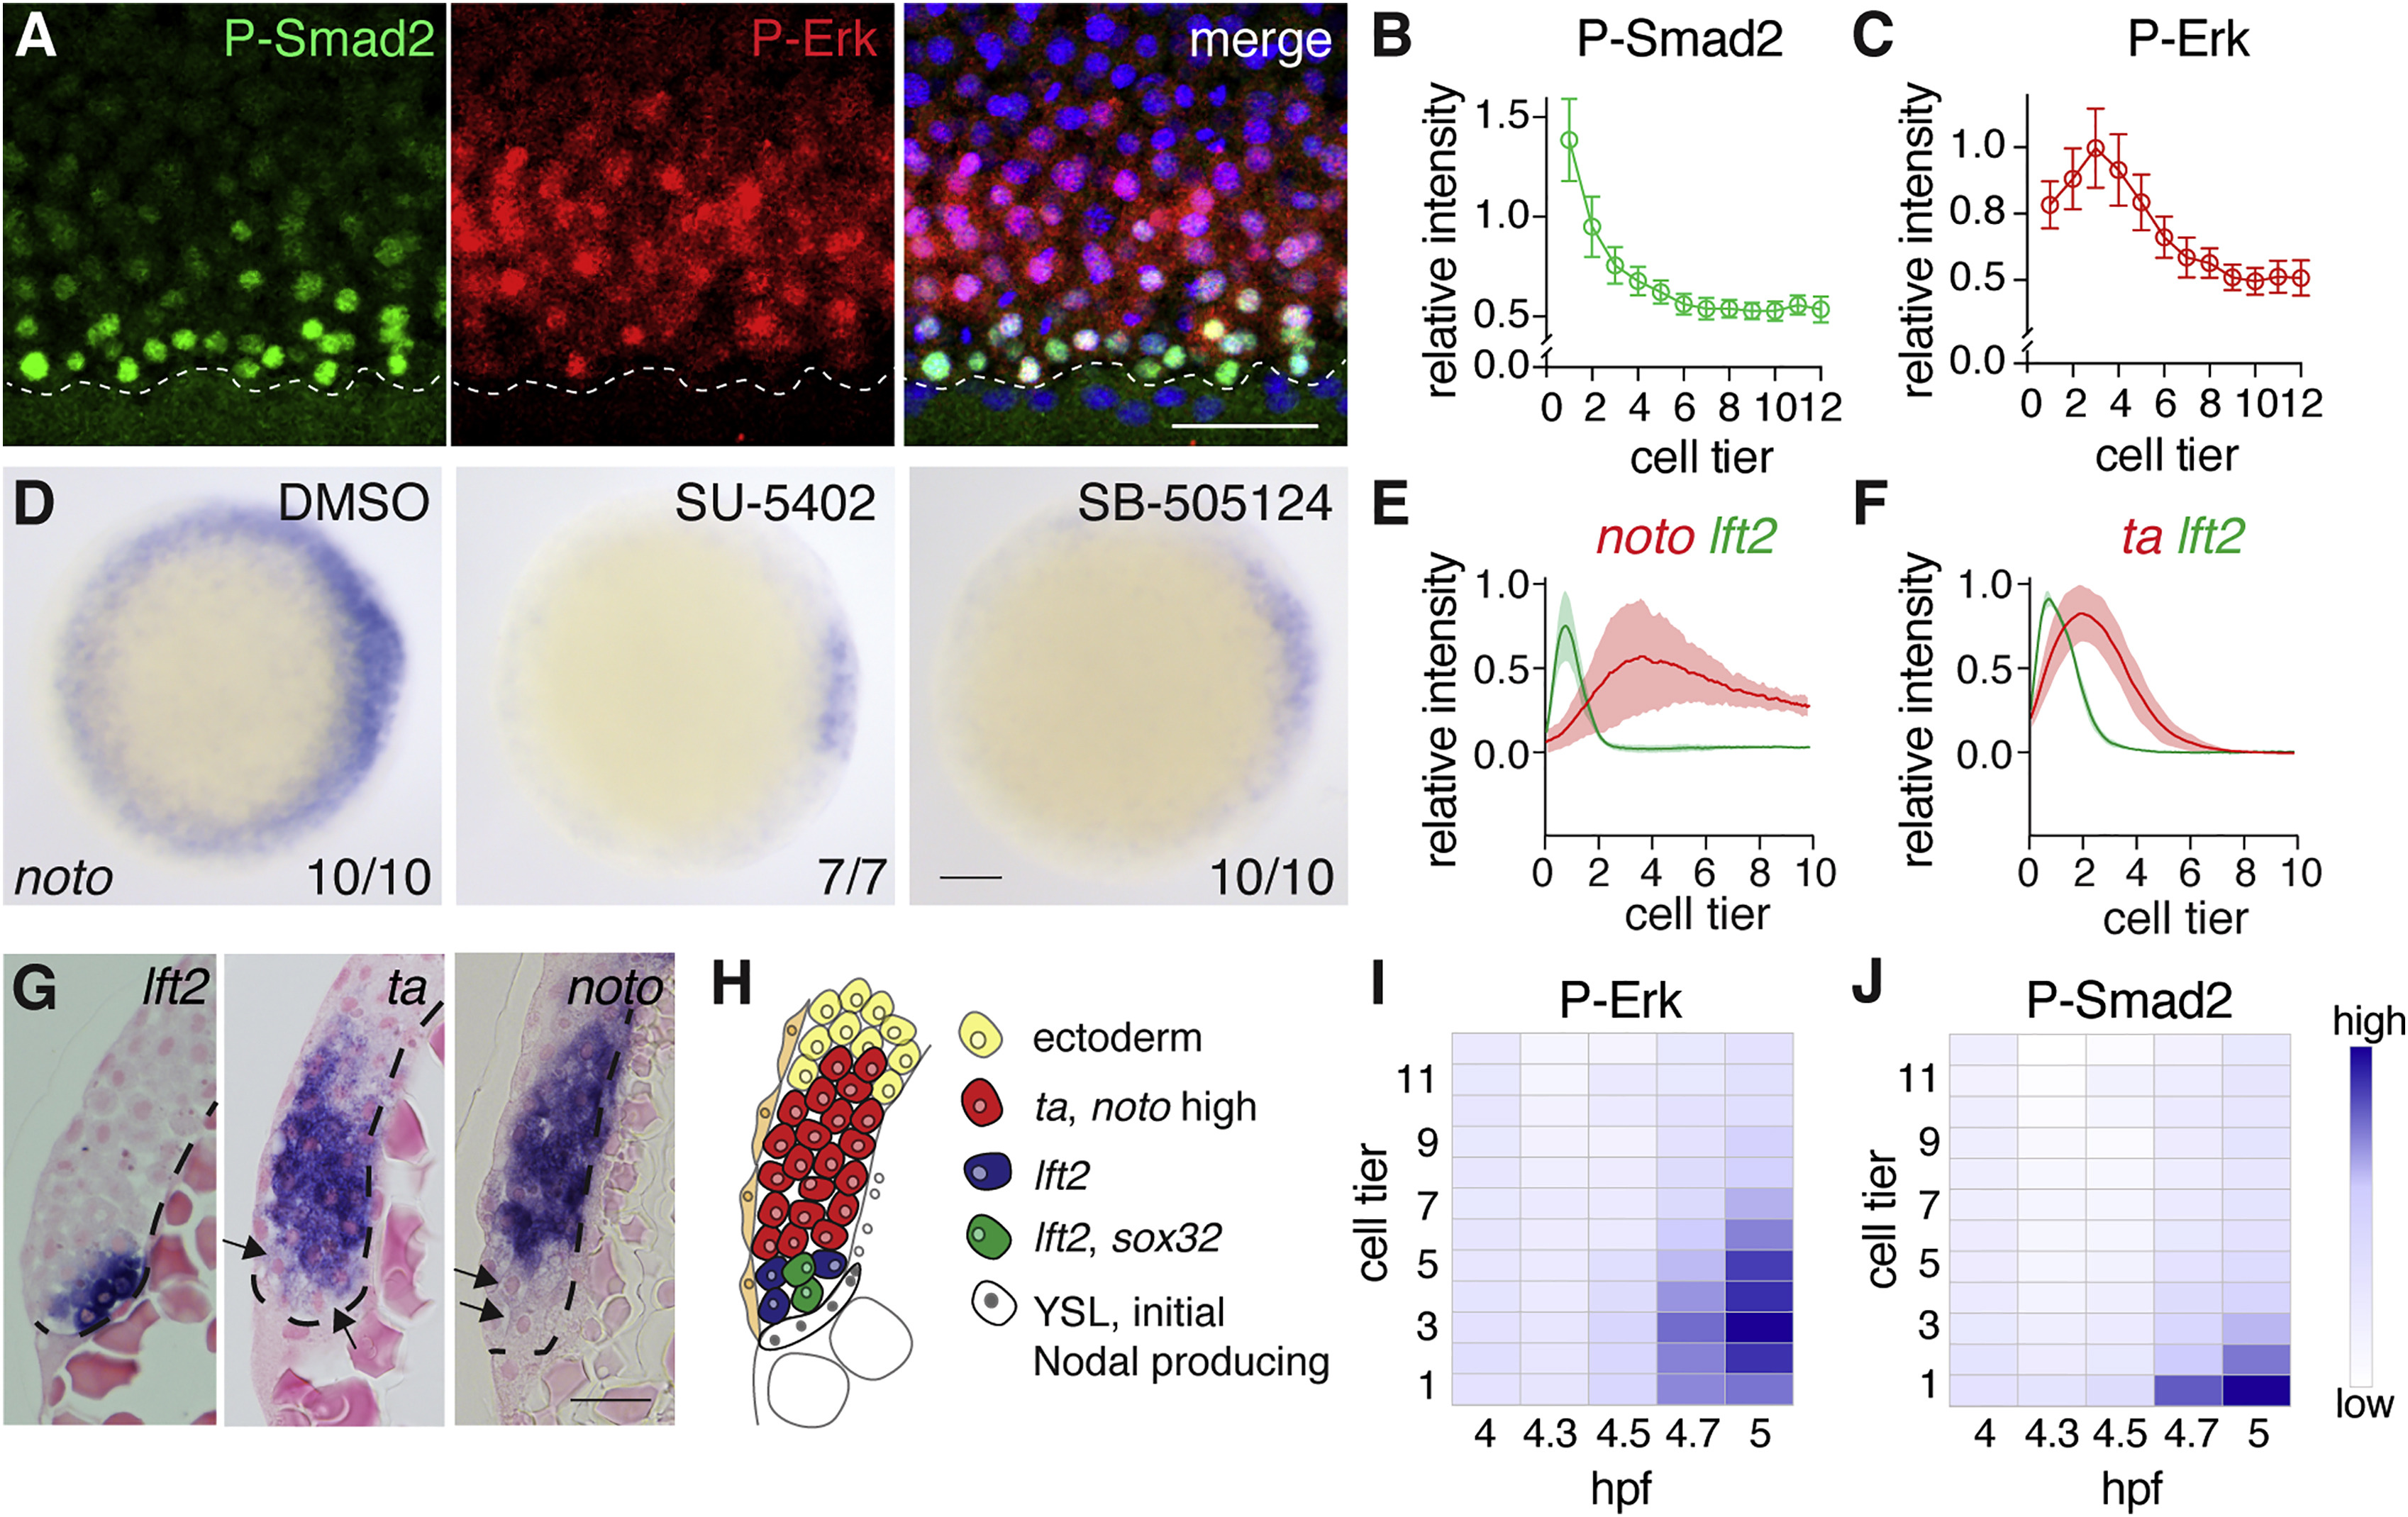
Cells Adjacent to the YSL Exhibit Low Levels of P-Erk
(A) Z-Projection of the margin of a 50%epiboly embryo stained for P-Erk and P-Smad2. Dashed line indicates the boundary between the YSL and the margin. Scale bar, 50 μm.
(B) Quantification of three embryos stained for P-Smad2 as in (A). Depicted is the mean ± SD from a representative experiment (n > 3).
(C) As in (B) for P-Erk.
(D) Animal views of WISH-stained 50% epiboly embryos for noto, treated with the Fgf signaling inhibitor (SU-5402) or the Nodal signaling inhibitor (SB-505124). Note that the inhibition of noto expression by SB-505124 reflects the regulation of Fgf by Nodal. Scale bar, 100 μm.
(E) Quantification of unsaturated FISH-stained embryos for lft2 and noto at 50% epiboly. For each trace n = 3, means are shown by the lines, and the shading indicates the SD.
(F) As in (E), but for lft2 and ta.
(G) Sections of unsaturated WISH-stained embryos for lft2, ta, and noto. Arrows indicate cells with low levels of expression and dashed line marks the border of the YSL. Scale bar, 25 μm.
(H) Schematic representation of gene expression in the margin.
(I) Time course of weighted means of P-Erk staining intensities, normalized to DAPI in the margin from 4 hpf (sphere stage) to 5 hpf (40% epiboly).
(J) As in (I), but for P-Smad2.
See also Figure S2.
Reprinted from Developmental Cell, 44(2), van Boxtel, A.L., Economou, A.D., Heliot, C., Hill, C.S., Long-Range Signaling Activation and Local Inhibition Separate the Mesoderm and Endoderm Lineages, 179-191.e5, Copyright (2017) with permission from Elsevier. Full text @ Dev. Cell