
|
Fig. 4
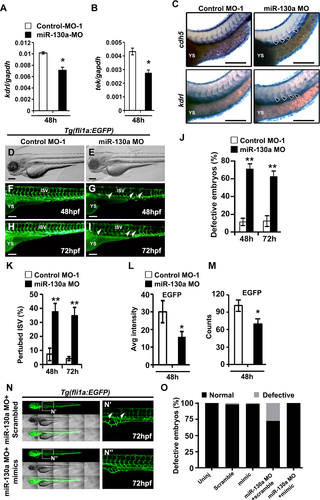
miR-130a regulates endothelial patterning in vivo.
A, B, qPCR analysis of endothelial transcripts, kdr1 and tek at 48hpf using RNA from control and miR-130a morphants. C, Whole-mount in situ hybridization images of control and miR-130a morphants at 48 hpf using cdh5 and kdr1 probes. Note the defective nature of vascular development and reduced expression of these transcripts in miR-130a morphants (arrowheads). D, E, Brightfield microscopic images revealed no major changes in gross morphology of mismatch control and miR-130a morphants. F-I, Lateral fluorescence images of Tg(fli1a:EGFP) zebrafish lines revealed defective vasculature in miR-130a morphants (white arrowheads) at 48 hpf (F, G) and 72 hpf (H, I) time periods. J, K, Quantitative analysis of the number of defective zebrafish embryos with perturbed inter-somitic vessels (ISVs) at 48 hpf and 72 hpf. L, M, ImageJ (L) and FACS (M) analyses of EGFP+ cells revealed significantly reduced EGFP intensity and counts in miR-130a morphants. N, Lateral fluorescence and brightfield images of Tg(fli1a:EGFP) zebrafish lines co-injected with miR-130a morpholinos and LNA modified scrambled oligos and miR-130a mimics at 72hpf. Panel N’ and N” shows the enlarged images of the boxed area in panel N. Note the restoration of the vascular structures following co-injection with miR-130a morpholinos and miR-130a mimics (N’, N”; arrowheads). O, Quantitative analysis of the number of defective zebrafish embryos with perturbed inter-somitic vessels (ISVs) 72 hpf. Error bars indicate SEM (n = 3; *p<0.05; **p < 0.01). Scale bar: 200 μm.