
Image
|
Figure Caption
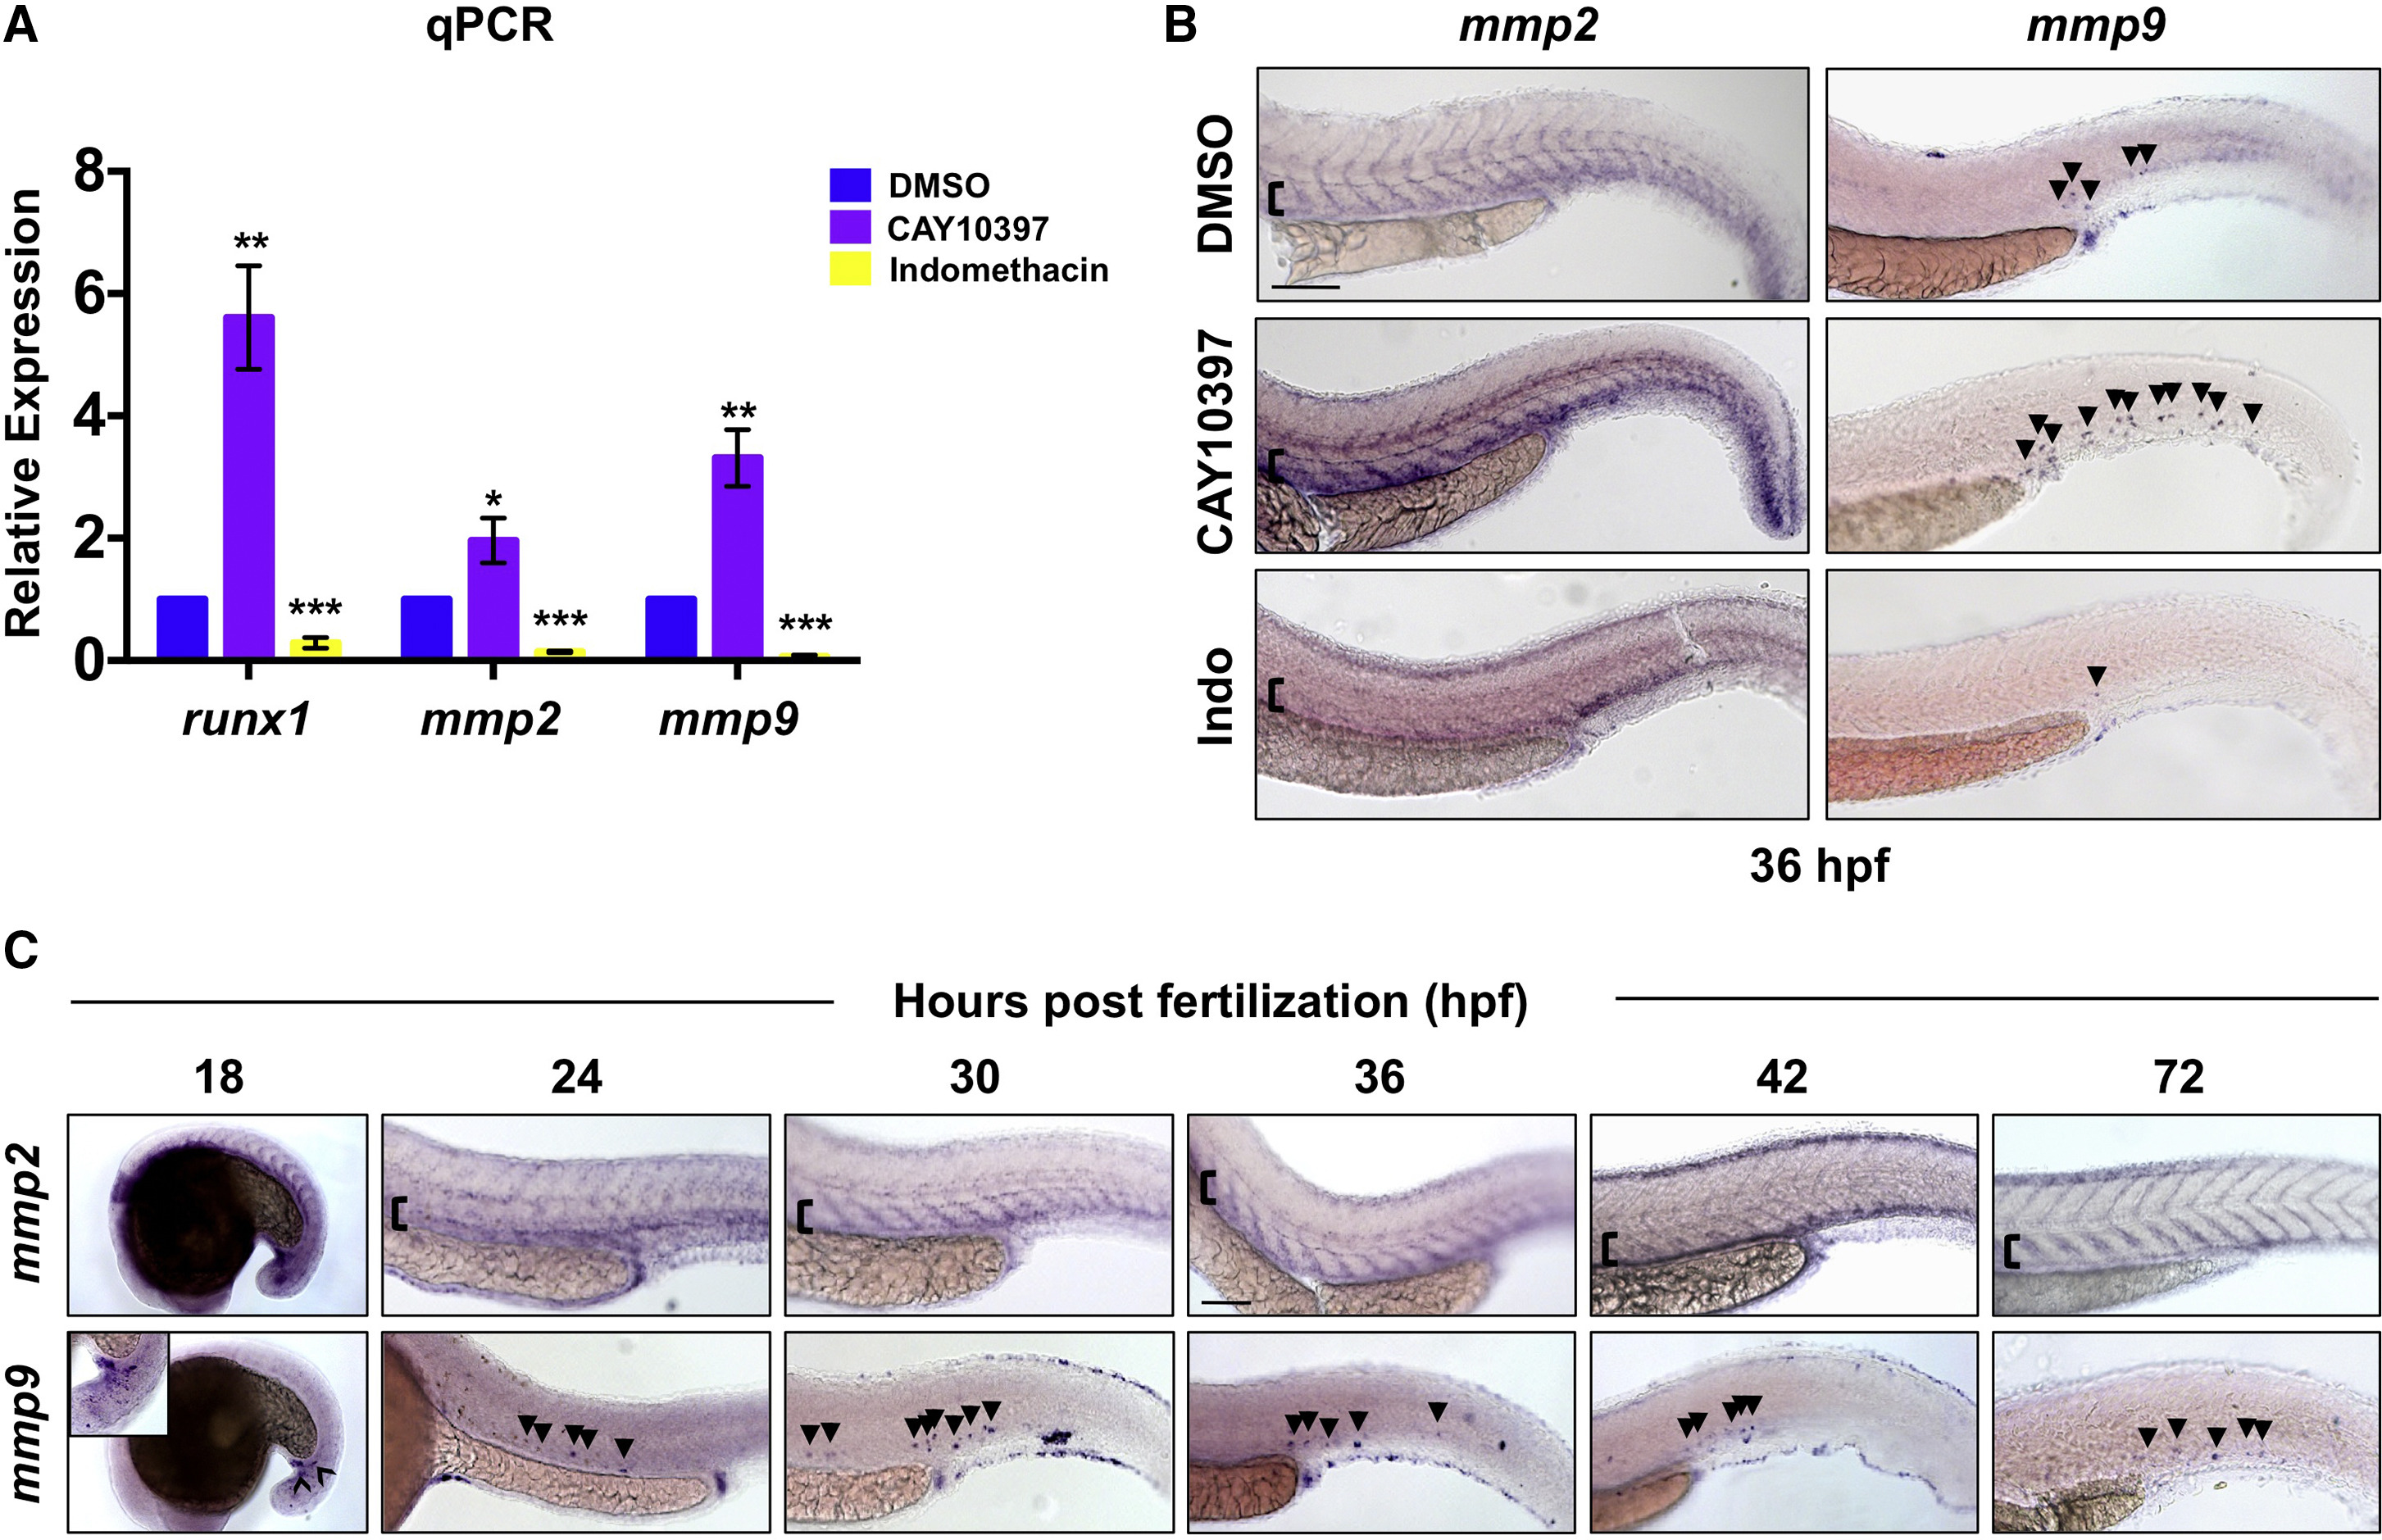
Fig. 1
Inflammatory Activity Regulates Mmp2 and Mmp9 Expression in the VDA
(B) CAY10397 (12–36 hpf) increased mmp2 and mmp9 expression, while indomethacin (Indo) diminished expression by WISH (n ≥ 20/condition).
(C) WISH time course (18–72 hpf) for mmp2 and mmp9 expression (n value as in B).
Arrowheads mark mmp9+ cells; brackets mark dorsal/ventral boundaries of the VDA and CV. Scale bars, 100 μm.
Figure Data
Acknowledgments
This image is the copyrighted work of the attributed author or publisher, and
ZFIN has permission only to display this image to its users.
Additional permissions should be obtained from the applicable author or publisher of the image.
Full text @ Stem Cell Reports