
|
Fig. 4
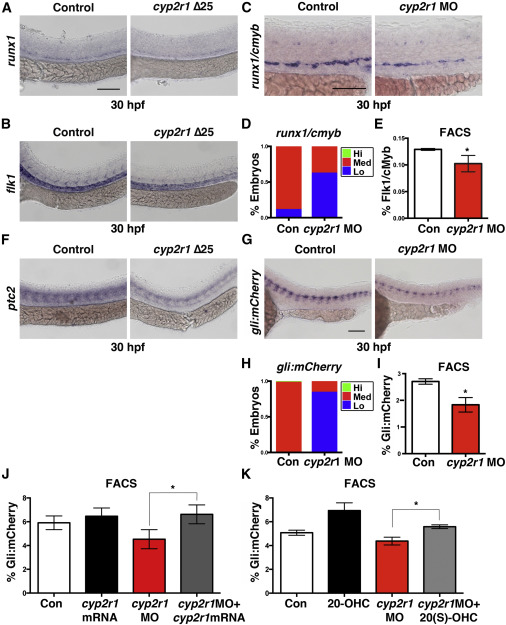
Cyp2r1 Inhibition and Failed D3 Hydroxylation Elicits Hh-Related Defects in HSPC Production
(A) WISH for runx1 showed cyp2r1 mutation results in HSPC defects. Scale bar, 100 μm.
(B) WISH for flk1 revealed minimal impact of cyp2r1 loss on trunk vessels. Scale as in (A).
(C) cyp2r1 morphants had diminished runx1/cmyb expression. Scale bar, 50 μm.
(D) Qualitative phenotypic distribution of embryos from (C) scored for runx1 (n > 30 embryos/condition).
(E) Flk:dsRed+/cMyb:GFP+ FACS indicated a 21% (∗p = 0.0328) decrease in HSCs in cyp2r1 morphants (5 embryos/sample × 4 replicates/condition). Error bars, mean ± SD.
(F) In cyp2r1 mutants, ptc2 WISH showed Hh signaling was affected by endogenous D3 accumulation (77% penetrance). Scale as in (A).
(G) WISH for Gli-reporter expression in cyp2r1 morphants confirmed low Hh activity was correlated with ineffective D3 hydroxylation. Scale bar, 100 μm.
(H) Qualitative phenotypic distribution of embryos from (G) scored for mcherry expression (n > 40 embryos/condition).
(I) FACS of cyp2r1-MO-injected Gli-reporter embryos revealed a 33% (∗p = 0.0065) decrease in Hh activity (n value and error bars as in E).
(J) Gli:mCherry FACS showed co-injection of zebrafish cyp2r1 mRNA-rescued, cyp2r1-MO-meditated decreases in Hh activity (∗p = 0.009) (n value and error bars as in E).
(K) 20(s)-OHC-rescued defects in Hh activity caused by cyp2r1 knockdown as shown by FACS of the Gli-reporter line (∗p = 0.0005) (n value and error bars as in E).
See also Figures S3 and S4.