
|
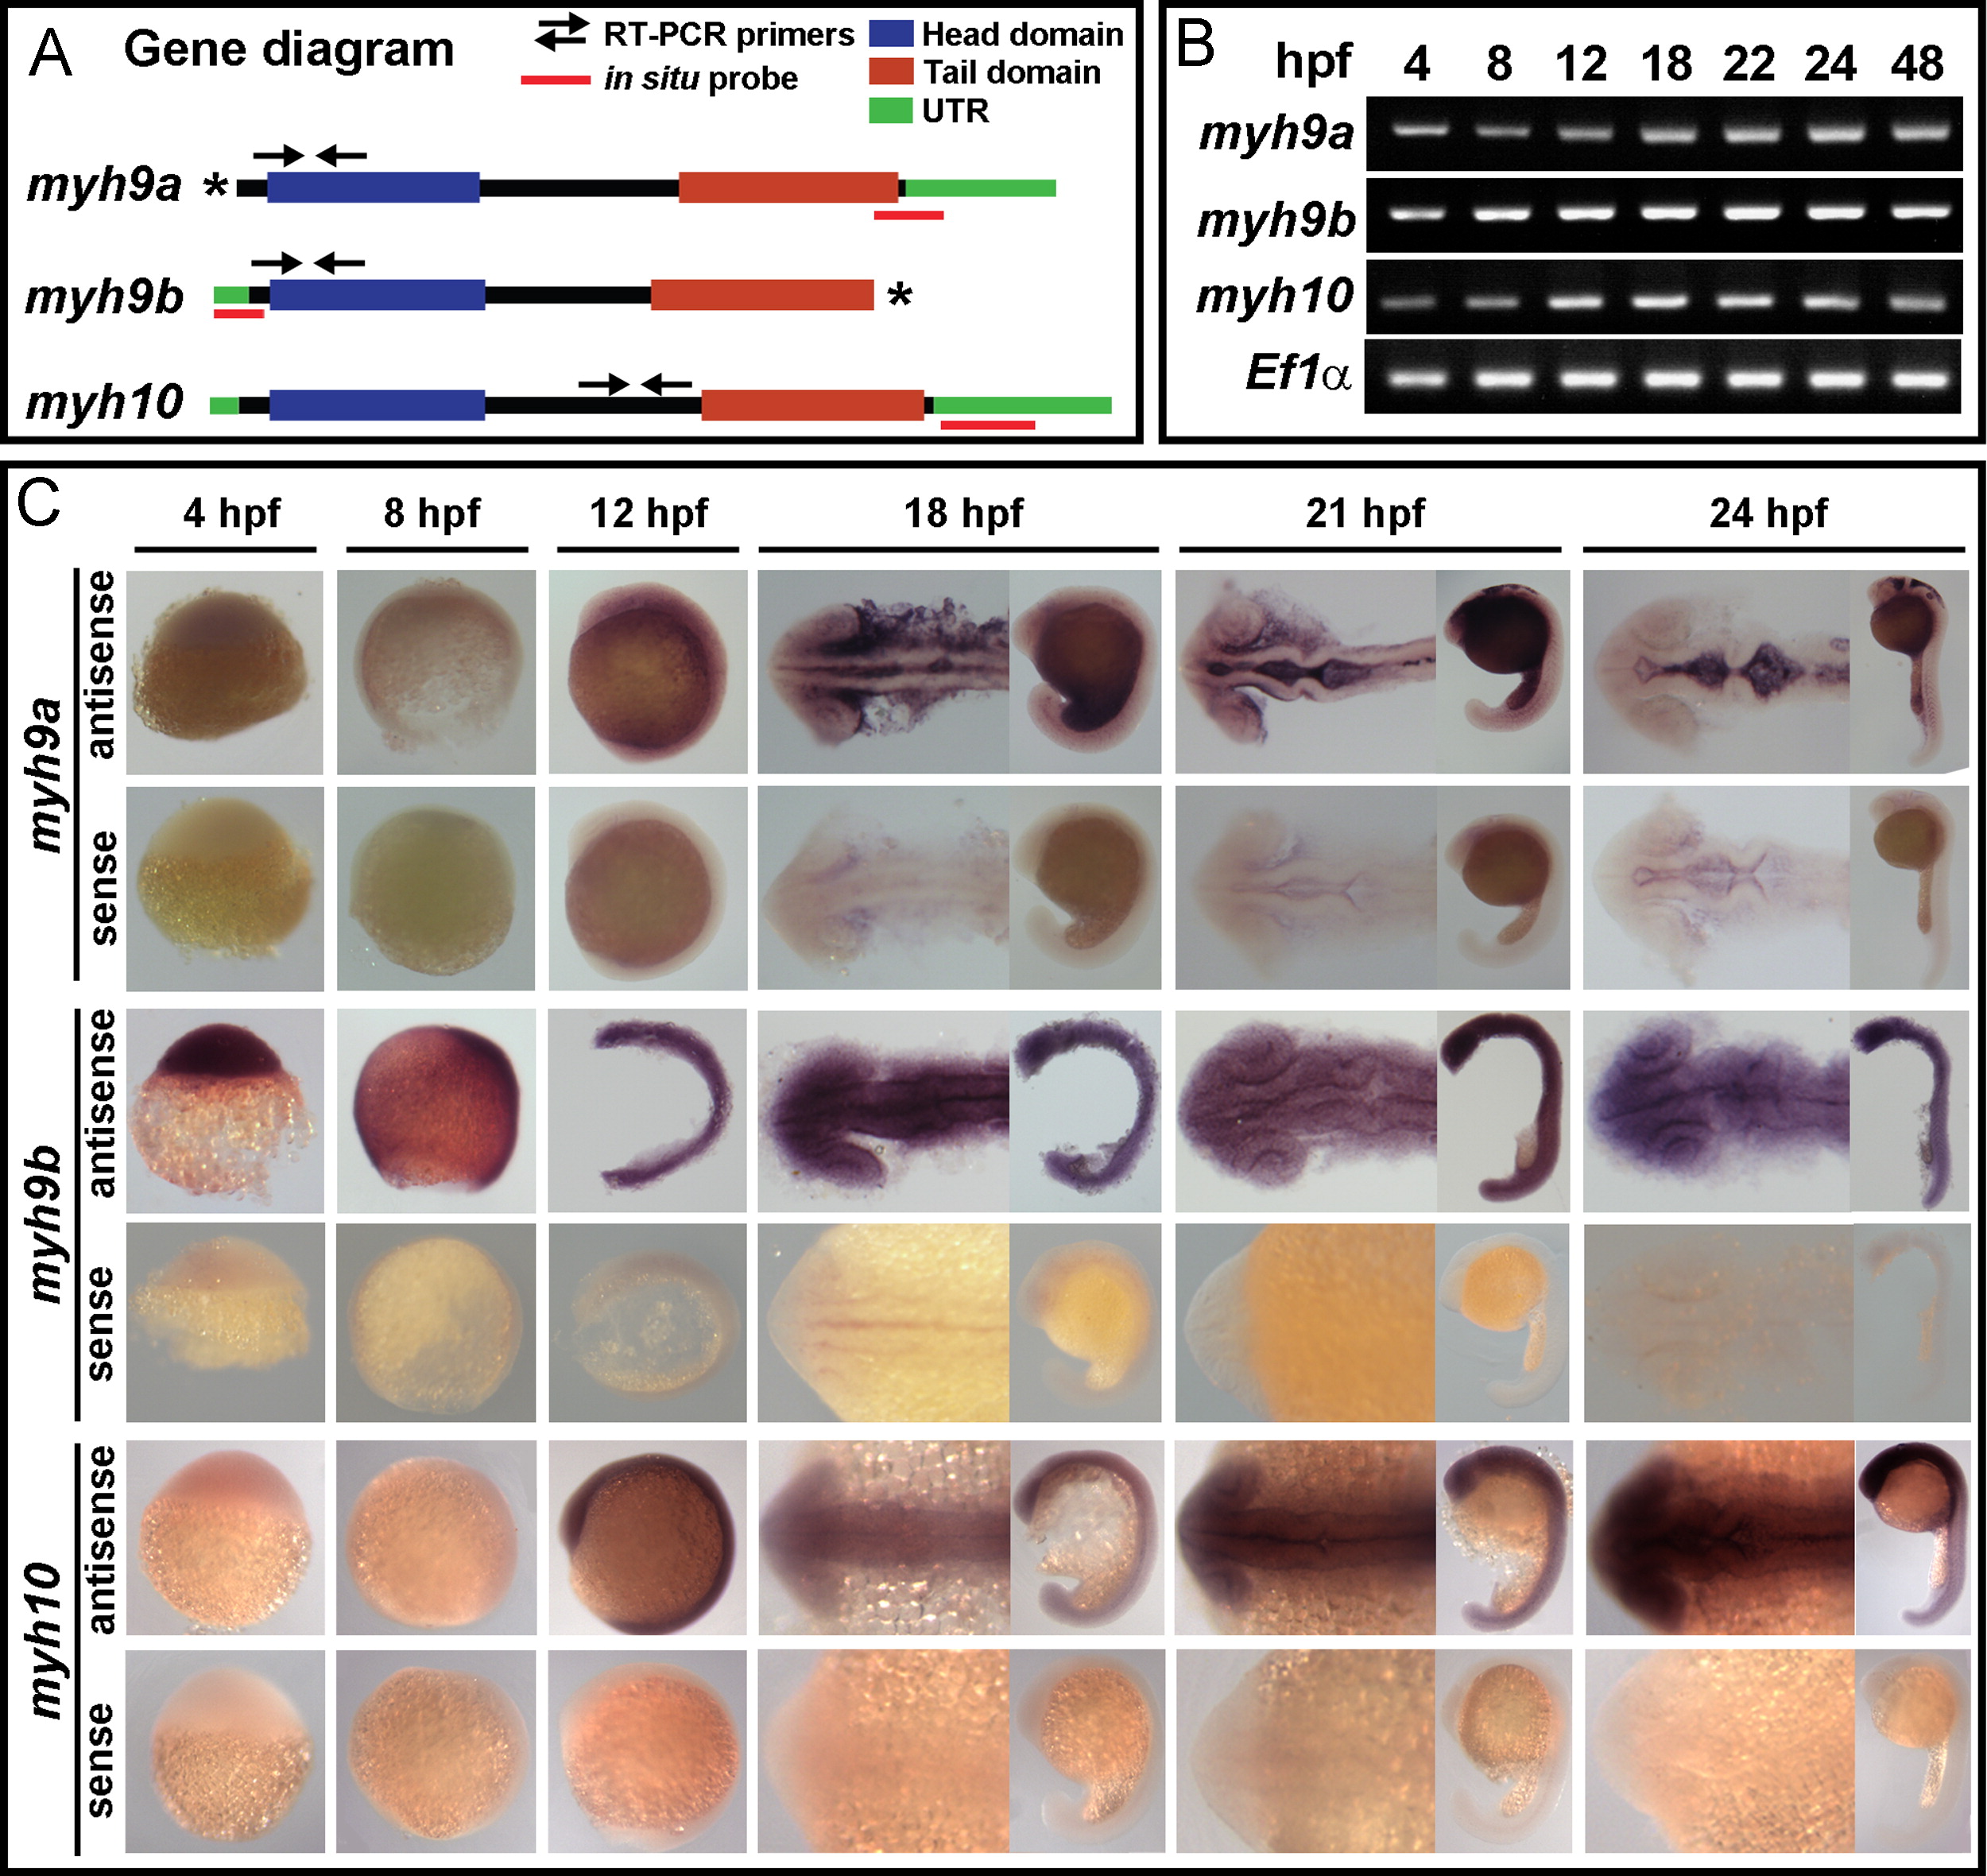
Fig. 1
myh9a, myh9b, and myh10 are expressed during the time of MHB morphogenesis. (A) Diagram of the zebrafish myh9a, myh9b, and myh10 genes. Domain regions are highlighted. Regions amplified for RT-PCR time course expression are shown with arrows (primer details can be found in “Materials and Methods”). Asterisks indicate the regions of the full length myh9a and myh9b in the current Ensembl zebrafish genome that have not been completely annotated. (B) RT-PCR analysis of myh9a, myh9b, and myh10 over a time course of embryonic development spanning MHB morphogenesis. EF1α was used as a control. Primer locations are indicated in panel A. (C) Time course of gene expression by in situ hybridization for myh9a, myh9b, and myh10 in the developing embryo from 4 hpf–24 hpf. Each gene is shown with the antisense probe expression pattern and sense control.
Reprinted from Developmental Biology, 397(1), Gutzman, J.H., Sahu, S.U., Kwas, C., Non-muscle myosin IIA and IIB differentially regulate cell shape changes during zebrafish brain morphogenesis, 103-15, Copyright (2015) with permission from Elsevier. Full text @ Dev. Biol.