
Fig. 2
|
Fig. 2
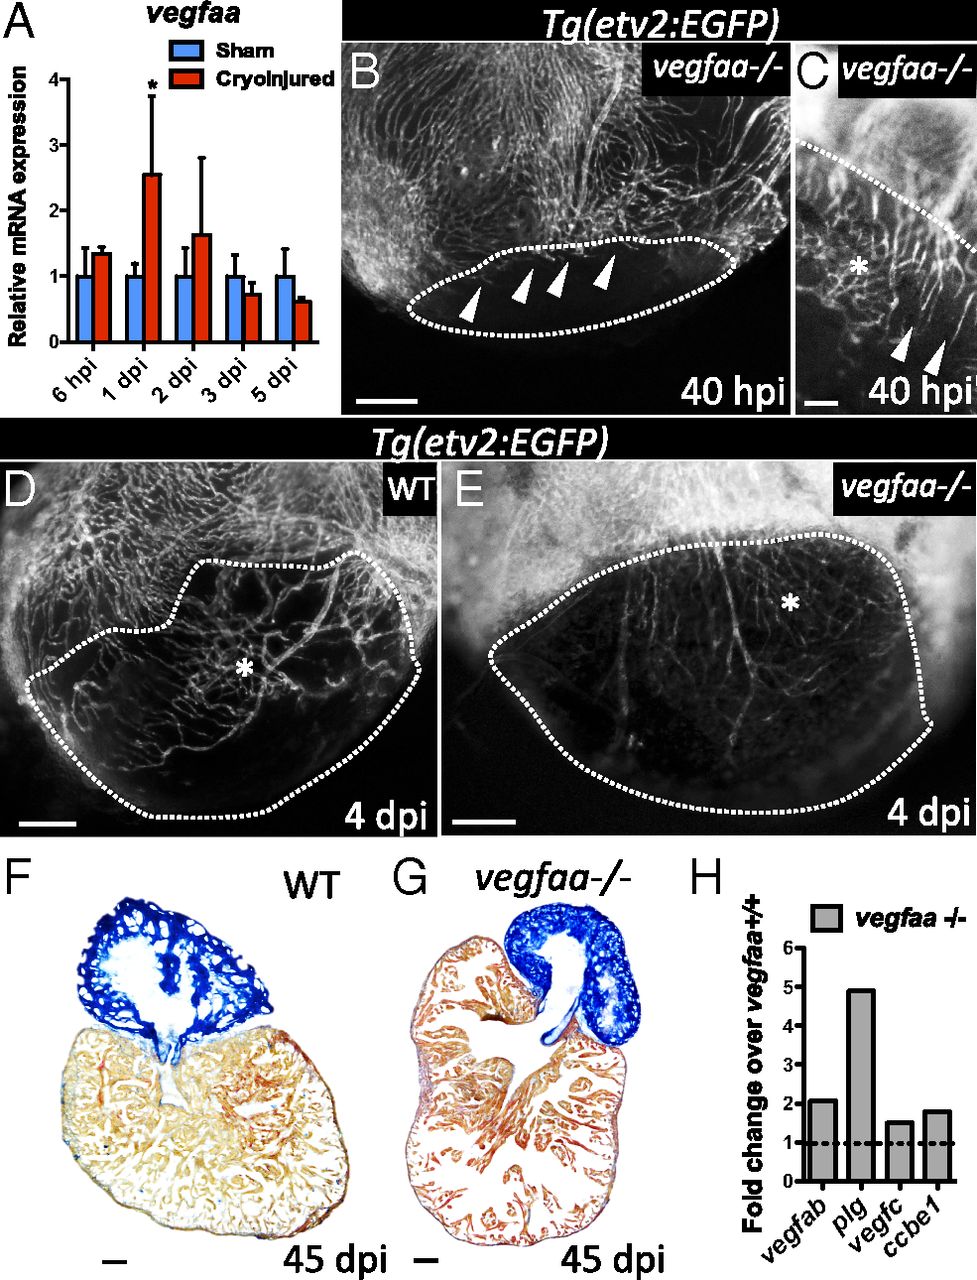
vegfaa mutants exhibit delayed and disorganized revascularization. (A) qPCR analysis of vegfaa expression at 6 hpi and 1, 2, 3, and 5 dpi. Data are expressed as mean ± SD, *P < 0.05 (n = 4). (B and C) Tg(etv2:EGFP) vegfaa-/- ventricles at 40 hpi (n = 3). White arrowheads point to coronary vessels sprouting into the injured area. (D and E) Tg(etv2:EGFP) WT (n = 5) and Tg(etv2:EGFP) vegfaa-/- ventricles at 4 dpi (n = 3). Asterisk marks an area of coronary plexus. Dotted lines delineate the injured area. (F and G) Sections of WT (n = 4) and vegfaa-/- (n = 4) ventricles at 45 dpi stained with AFOG to identify scar (blue), fibrin (red), and muscle (orange). (H) Microarray profiling of vegfaa+/+ and vegfaa-/- ventricles. Data are shown relative to vegfaa+/+ ventricles, which are set at 1 (dashed line). (Scale bars: B–E, 50 µm; F and G, 100 µm.)