
|
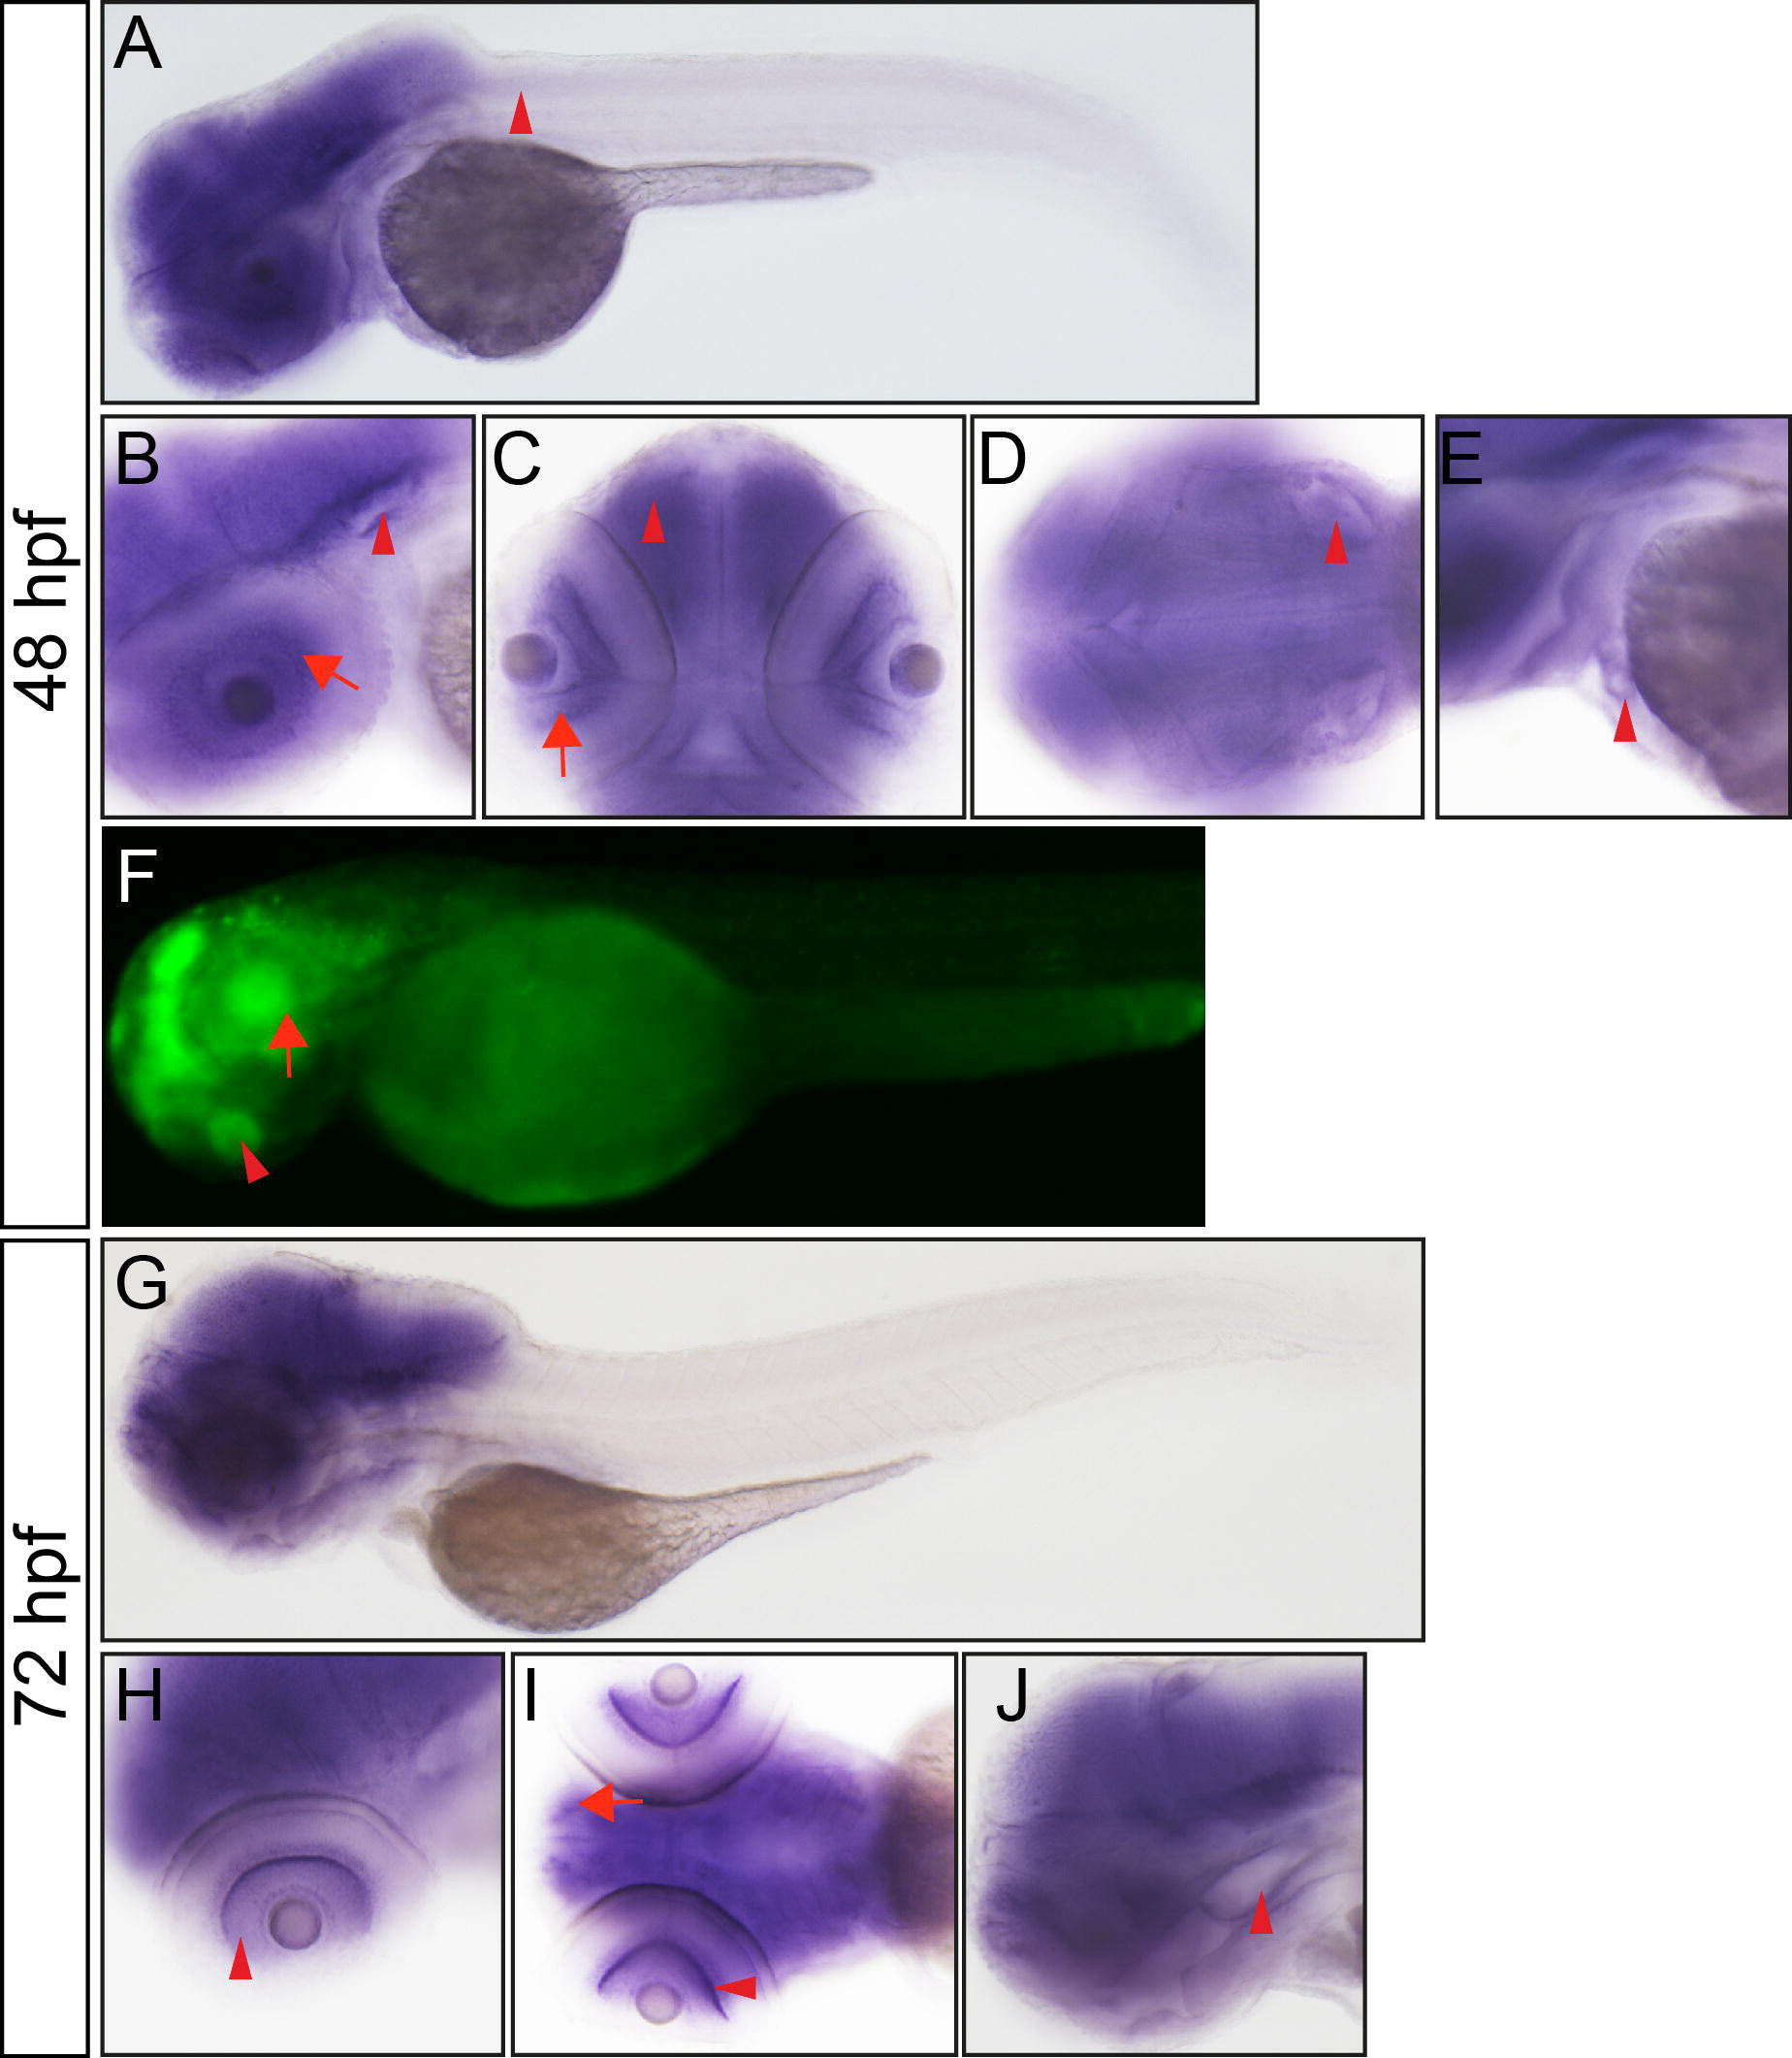
Fig. 4
Expression pattern of myh10 was analyzed by whole mount in situ hybridization and whole mount antibody staining at 48 hpf and 72 hpf stages embryos. (A) 48 hpf, lateral view, myh10 expression in brain and anterior spinal cord. (B) 48 hpf, lateral view, retina (arrow), ear (arrowhead). (C) 48 hpf, ventral view, retina (arrow) and olfactory bulb (arrowhead). (D) 48 hpf, dorsal view, ear (arrowhead). (E) 48 hpf, lateral view, heart (arrowhead). (F) 48 hpf, lateral view, retina (arrow) and olfactory bulb (arrowhead). (G) 72 hpf, lateral view. (H) 72 hpf, lateral view, retina (arrowhead). (I) 72 hpf, ventral view, retina (arrowhead), olfactory bulb neurons (arrow). (J) 72 hpf, lateral view, otic capsule.
Reprinted from Gene expression patterns : GEP, 13(7), Huang, Y., Wang, X., Wang, X., Xu, M., Liu, M., and Liu, D., Nonmuscle myosin II-B (myh10) expression analysis during zebrafish embryonic development, 265-270, Copyright (2013) with permission from Elsevier. Full text @ Gene Expr. Patterns