
|
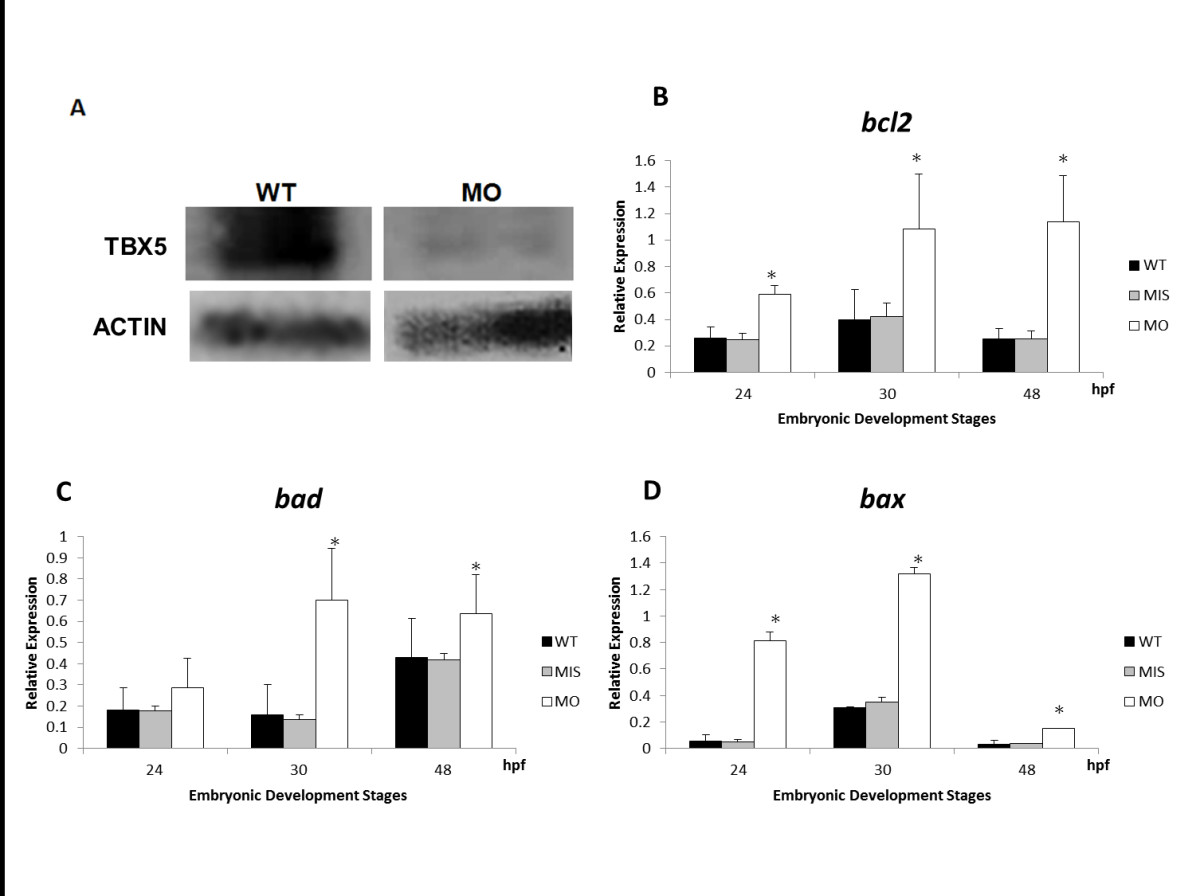
Fig. 2
Quantification of apoptosis-related gene expressions in tbx5 deficiency zebrafish embryos using a semi-quantitative PCR. A: The efficiency of the tbx5-MO was tested using Western blot. Tbx5-MO remarkably inhibited the expression of the TBX5 protein (n = 3, 100 embryos). B-C: The proapoptotic genes, bad (B) and bax (C), were significantly activated in tbx5-MO-treated embryos. D: The antiapoptosis gene, bcl2, was significantly induced in tbx5 knockdown embryos throughout the developmental stages (n = 3, 50 embryos/stage; relative expression, gene expression/²-actin expression). Data are presented as the mean ± S.D. An asterisk indicates a significant difference (p < 0.05).