
Fig. 4
|
Fig. 4
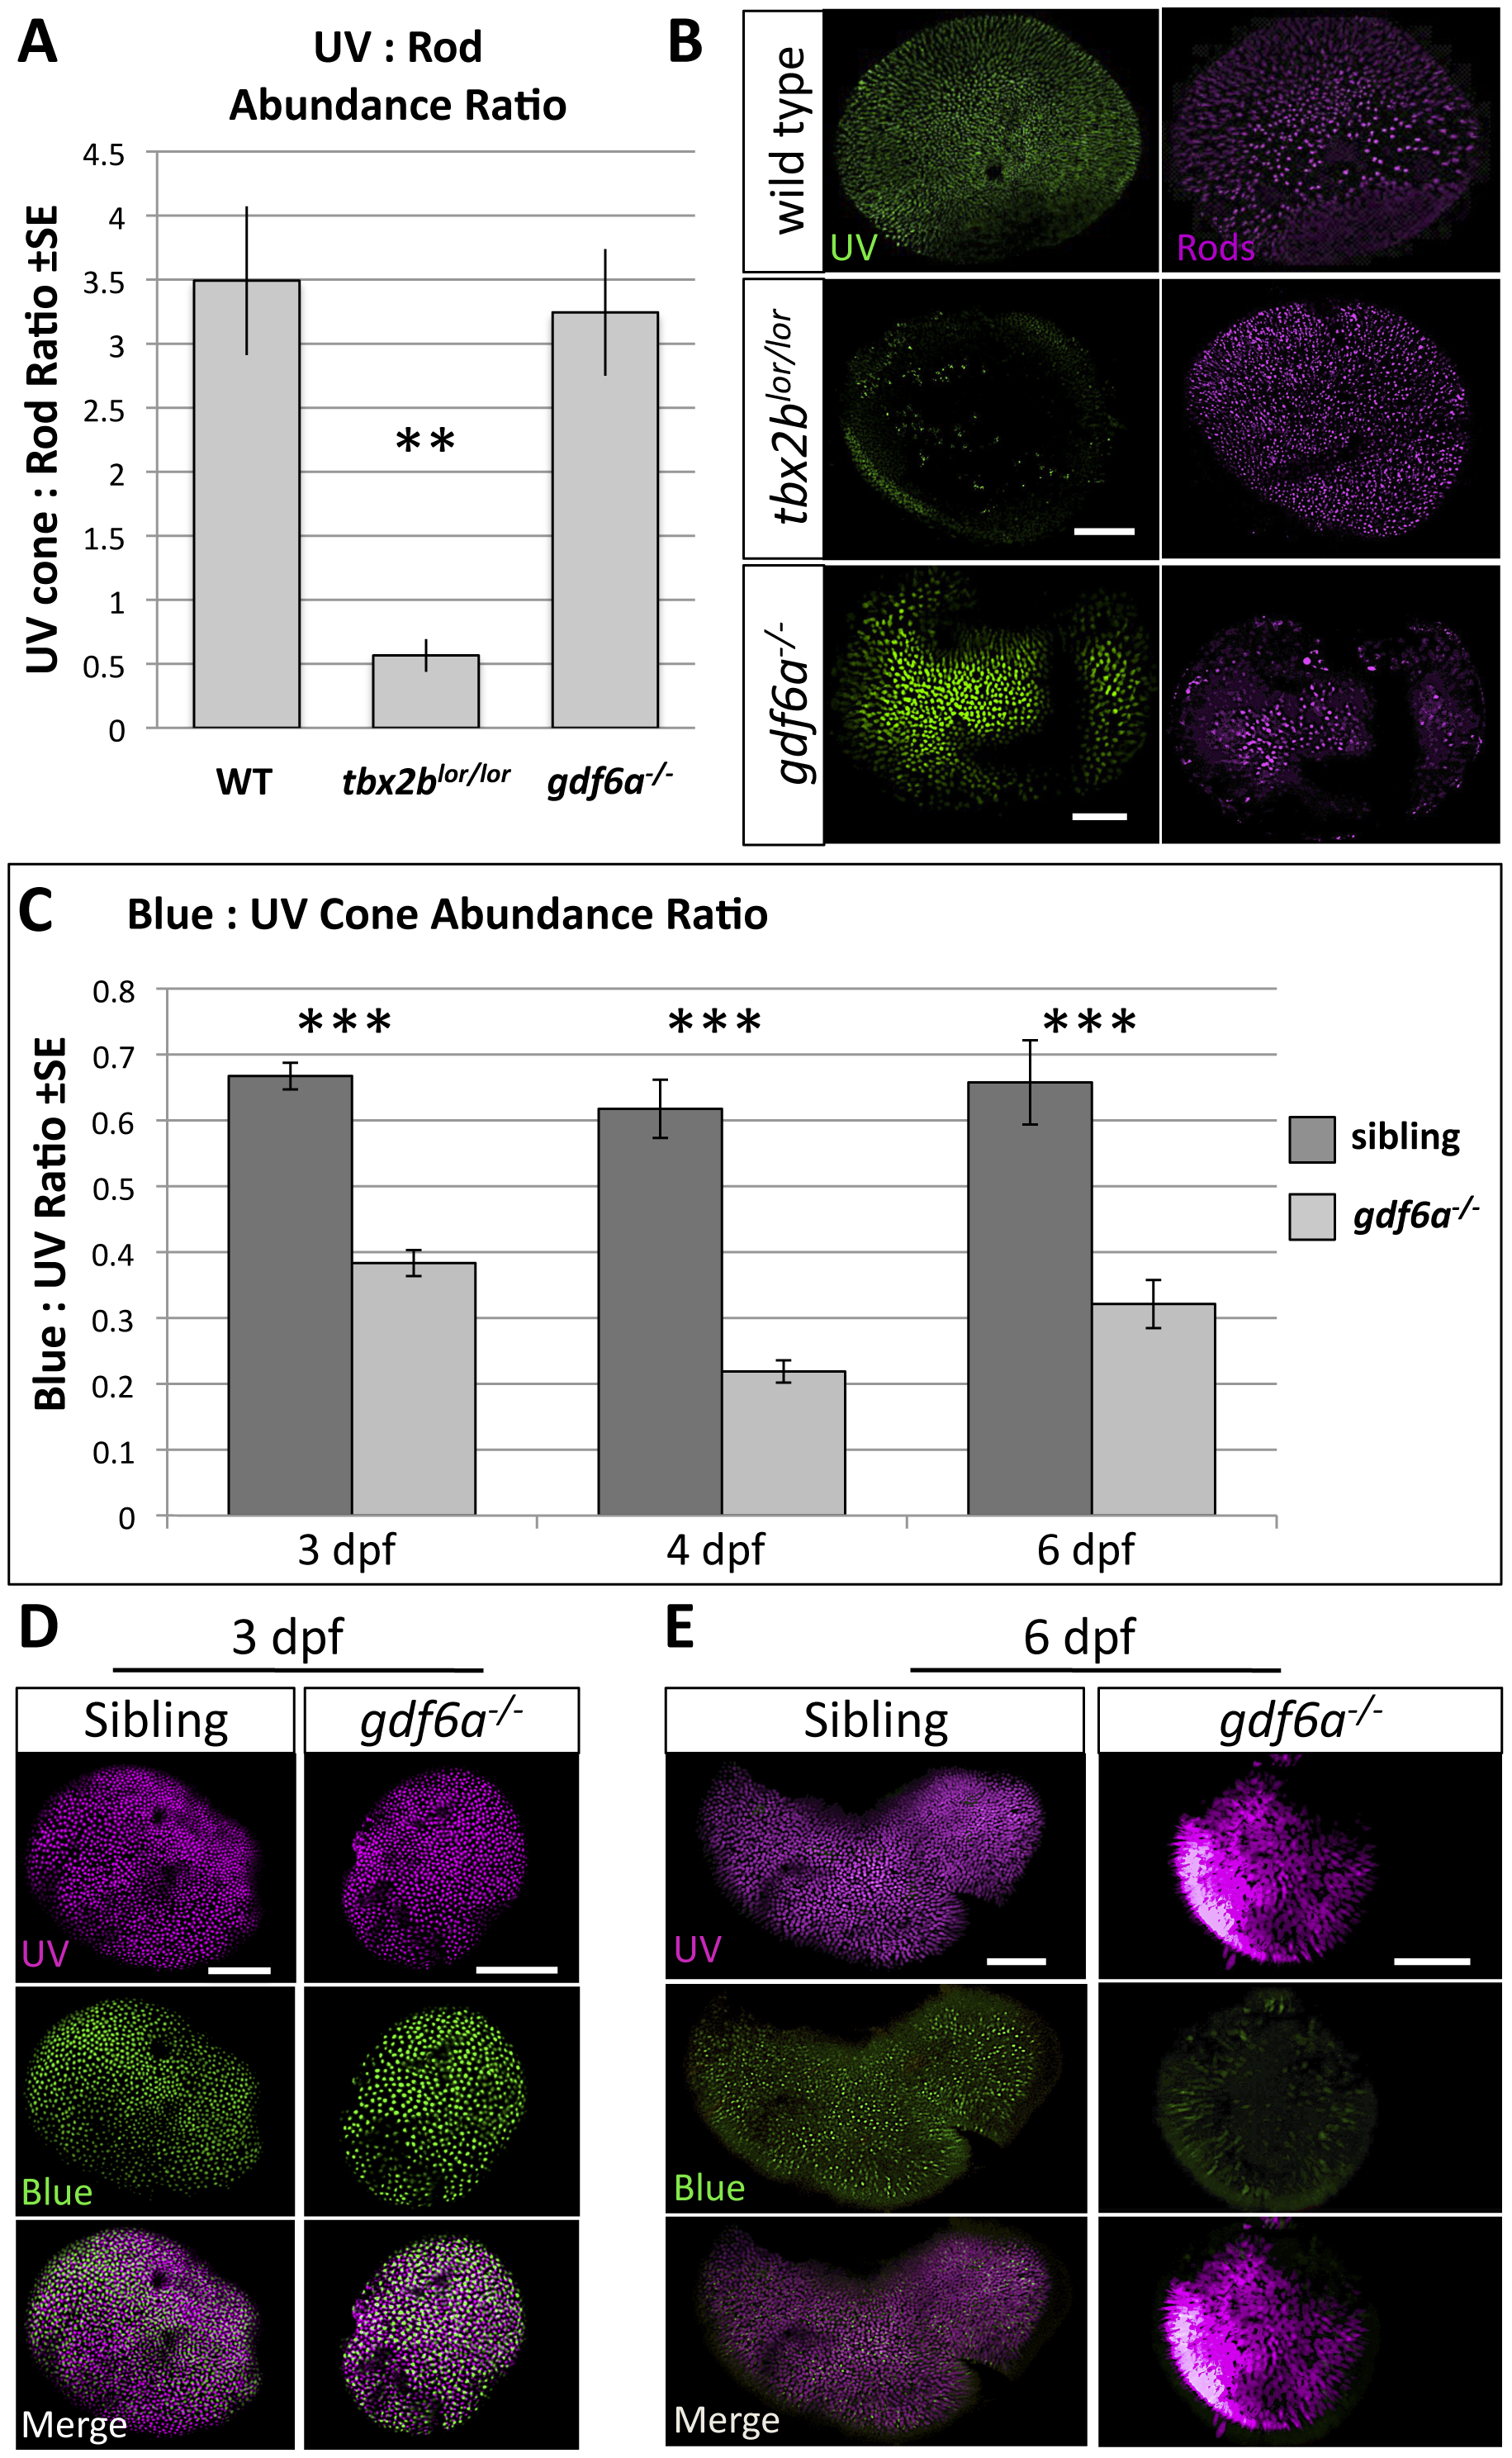
Mutation in gdf6a does not disrupt tbx2b function in UV-versus-rod photoreceptor specification, but gdf6a rather plays a role in blue cone specification.
A,B. tbx2blor/lor mutants have fewer UV cones and more rods than wildtype fish (the lots-of-rods phenotype) (Kruskall-Wallis ANOVA, **p<0.005), but gdf6as327/s327 mutants have a normal abundance ratio and distribution of UV cones and rods (n = 10 wildtype, 8 tbx2blor/lor, and 7 gdf6as327/s327; UV cones expressing GFP and rods were labeled with antibody 4C12). Scale bars 30 µm and 80 µm, respectively. C. Larval gdf6as327/s327 mutants have a unique cone photoreceptor phenotype in which there are significantly fewer blue cones relative to UV cones at all ages examined (which is not observed in tbx2blor/lor or tbx2bfby/fby mutants- not shown) (Kruskall-Wallis ANOVA, ***p<0.001) Sample sizes at 3 days post-fertilization (dpf) are n = 17 larvae per genotype quantifying cells visualized via opsin in situ hybridization (Panel D); at 4 dpf data are from n = 9 wild type and n = 13 mutants assessed via GFP and mCherry transgene expression in cones; at 6dpf data are from 2 replicates of n = 4+7 wild type and n = 5+6 mutants assessed via transgene expression in cones (Panel E). D. UV and blue cones identified in 3 dpf by in situ hybridization against their respective opsins (Scale bars are 100 µm). E. UV and blue cones identified in transgenic lines at 6dpf by expression of GFP and mCherry, respectively (Scale bars are 60 μm and 40 μm in sibling and mutants, respectively).