
|
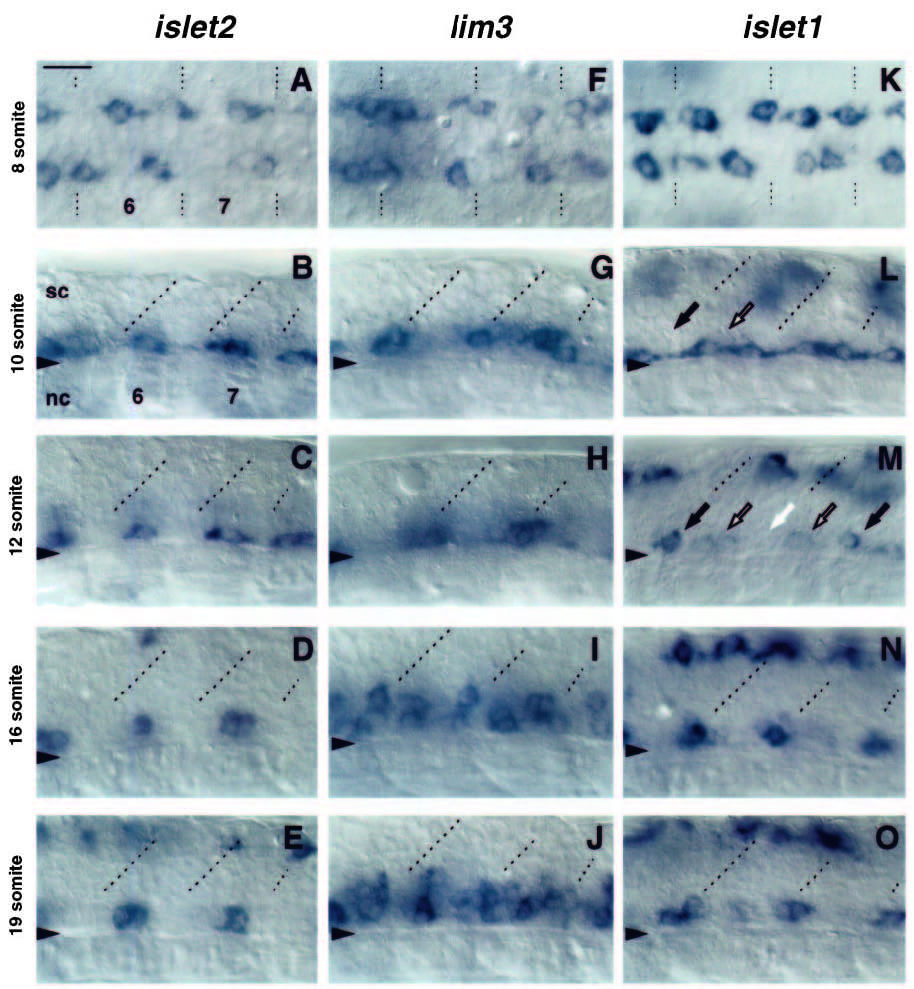
Fig. 4 Developmental profile of LIM homeobox gene expression in the trunk ventral spinal cord. Expression of islet2, lim3 and islet1 RNA at similar axial positions at different times of development. All photos were taken at somite levels 6 and 7. Anterior is to the left for each panel. Dotted lines mark approximate positions of somite boundaries. Triangles indicate the ventral boundary of the spinal cord. A, F and K are dorsal views of the neural keel at the 8-somite stage. Remaining panels are lateral views with dorsal at the top. Scale bar equals 20 μm. sc, spinal cord; nc, notochord. (A) islet2 RNA is expressed in 1- 2 irregularly spaced cells per hemisegment at the 8-somite stage. (B) islet2 RNA in 1-2 midsegment cells at the 10- somite stage. (C) islet2 expression in 1-2 midsegment cells at the 12-somite stage. (D) islet2 RNA in 1-2 midsegment cells at the 16- somite stage. (E) islet2 expression maintained in 1-2 midsegment cell pattern at the 19-somite stage. Dorsal labeling, here and in D (one cell), indicates expression in cells that are probably Rohon-Beard sensory neurons, based on their locations. (F) lim3 is expressed in a variable number of cells clustered near somite boundaries in 8-somitestage embryos. (G) Clusters of cells expressing lim3 RNA near somite borders at the 10-somite stage. (H) Approximately three cells near somite borders express lim3 at the 12-somite stage. (I) lim3 RNA expressed in border and midsegment cells at the 16-somite stage. (J) Expression of lim3 in numerous ventral spinal cord cells at the 19-somite stage. (K) islet1 RNA is expressed in 2-3 variably spaced cells per hemisegment in the anterior neural keel of an 8-somite-stage embryo. (L) islet1 RNA detected in one cell near somite boundaries (black arrow) and one midsegment cell (outlined arrow) at the 10-somite stage. (M) Down regulation of islet1 RNA at the 12-somite stage. Single cells expressing high levels of islet1 RNA are seen at the anterior borders of the 6th and 8th somites (black arrows) but not of the 7th (white arrow). Low levels of RNA are seen in midsegment cells (outlined arrows). Labeling in the dorsal spinal cord represents expression in putative Rohon-Beard sensory neurons. (N) High levels of islet1 RNA in single cells at each somite border at the 16- somite stage. (O) islet1 RNA in two cells at each somite border at the 19-somite stage.