
Fig. 11
|
Fig. 11
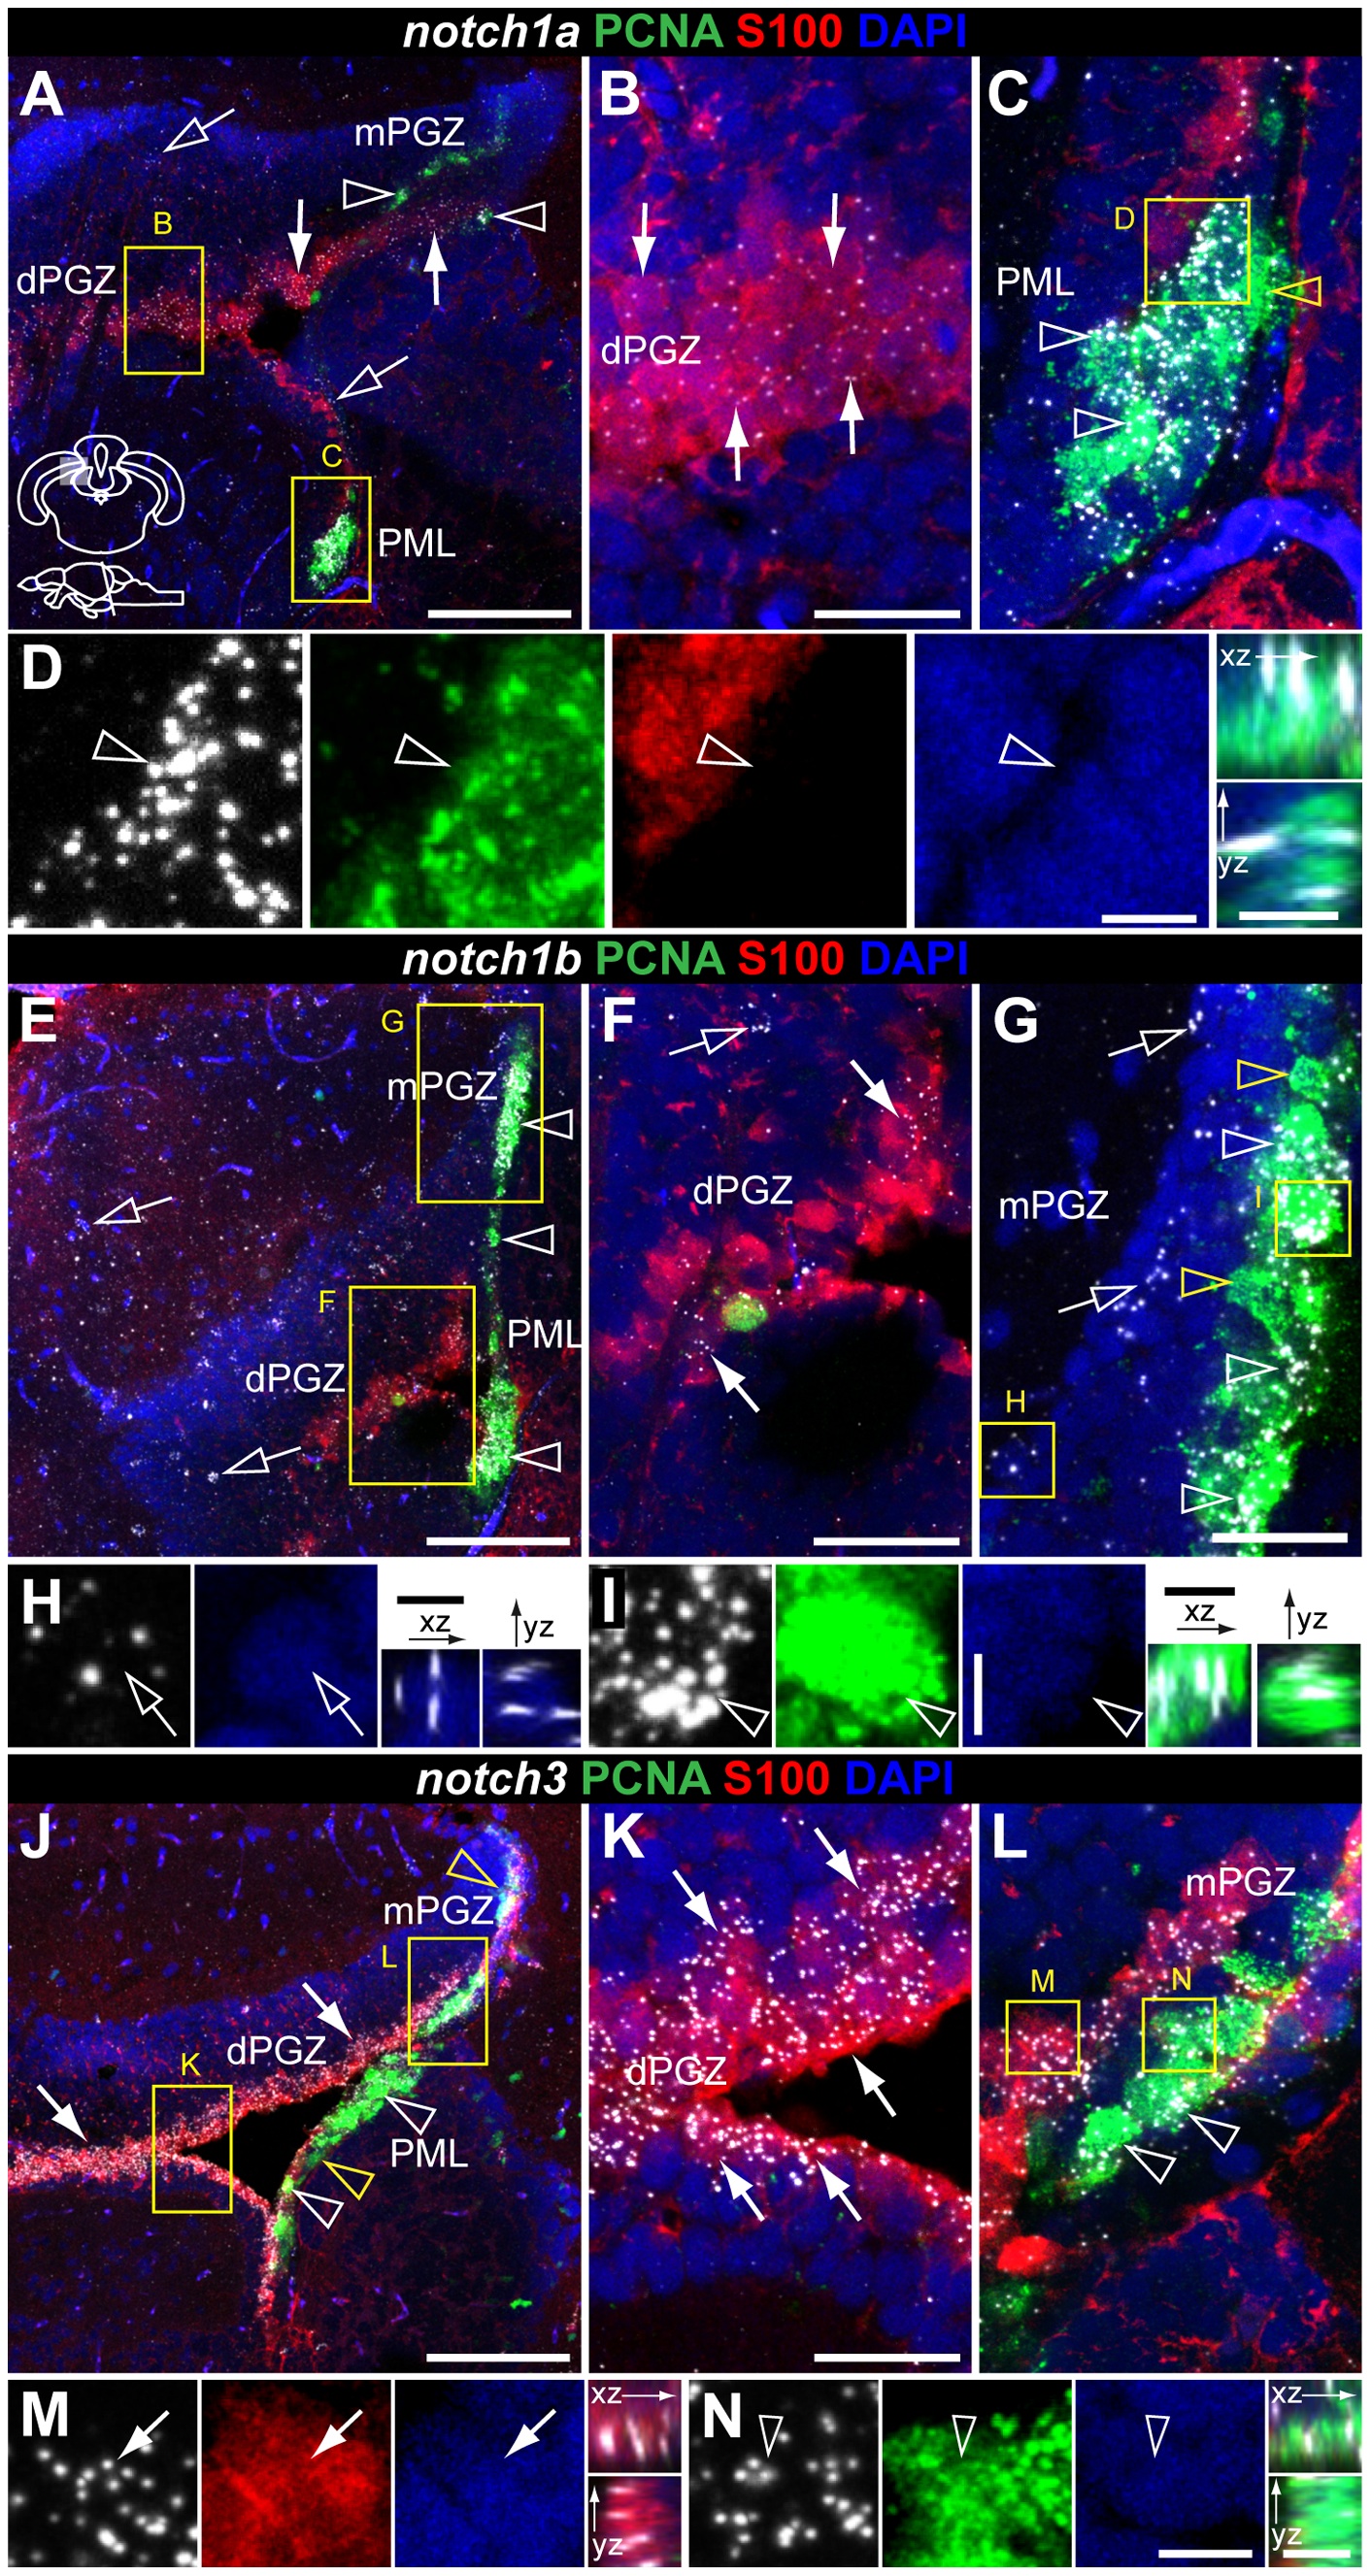
Notch receptor expression in radial glia and proliferating cells of the adult zebrafish optic tectum.
Cross-sections at the indicated level through the mesencephalon; optic tectum area shown in the micrographs is indicated in the cross section schematic in A. Confocal images showing localization of the glial marker S100β (red) and the proliferation marker PCNA (green), with A-D, notch1a, E-I, notch1b and J-N,notch3 by FISH (white). A, notch1a, E, notch1b and J, notch3 are present in PCNA + cells of the mPGZ and PML (unfilled white arrowheads) and in S100β glial cells of the dPGZ; cells in the superficial layer of the PGZ expressing notch1a and notch1b are also found (unfilled arrows), with relative more abundance for the notch1b receptor in this layer; B, C, F,G and K,L are higher magnifications of the respective framed areas in A, E and J, showing the overlap of notch expression with S100 (filled arrows) or PCNA (unfilled white arrowheads); unfilled yellow arrowheads in C, G and J indicate a few Notch receptor - /PCNA + cells; D, H, I, M,N, close ups of Notch receptor expressing cells in the above mentioned areas and orthogonal views of the indicated cells. Abbreviations: PGZ, periventricular gray zone of the optic tectum; dPGZ, deep layer of the PGZ; mPGZ, mitotic region of the PGZ; PML, posterior mesencephalic lamina. Scale bars = 100μm in A, E and J; 20 μm in B (applies to C), in F, G and K (applies to L); 5 μm in D, I (applies to H) and N (applies to M).