
|
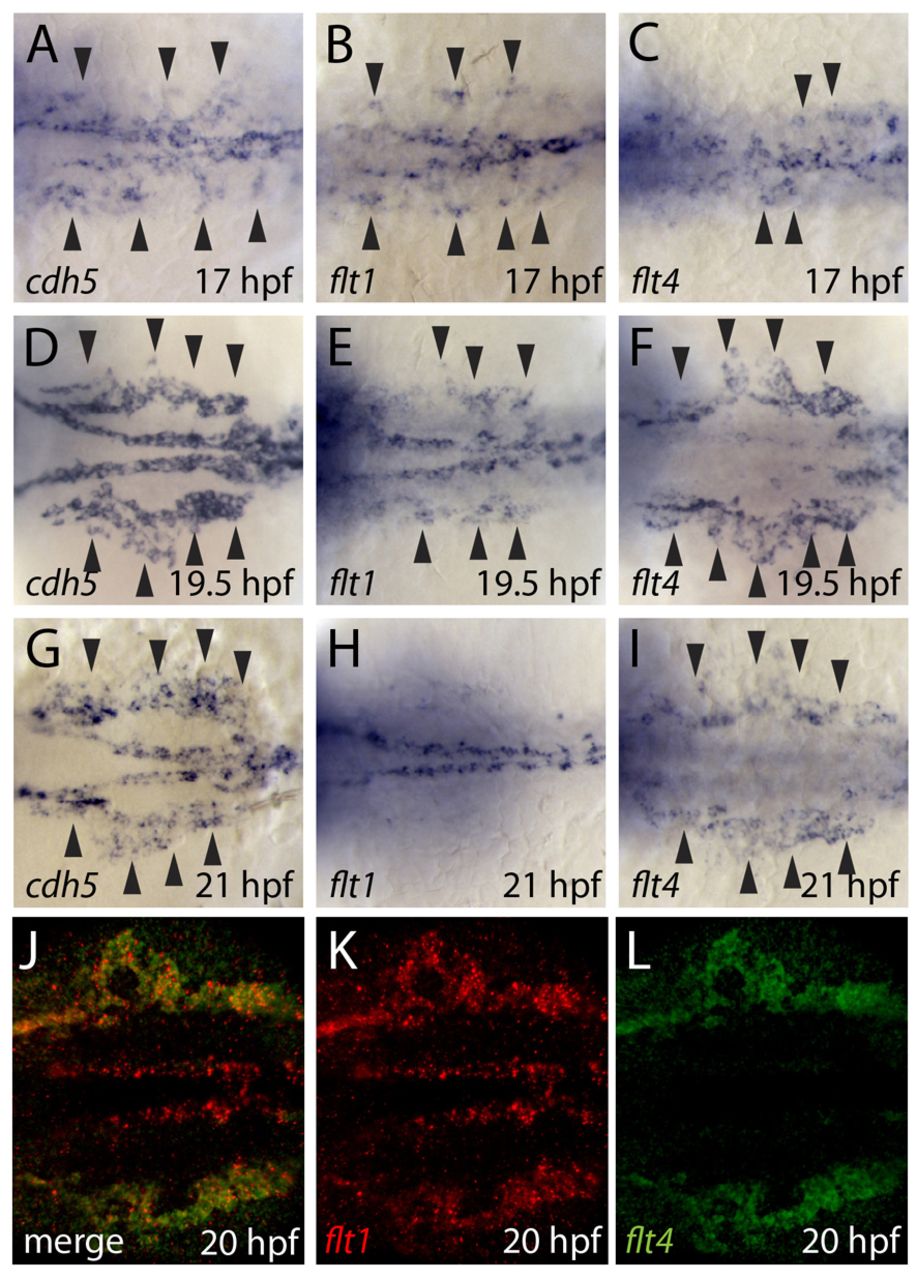
Fig. 2 All angioblasts show a common expression profile prior to arterial-venous differentiation. (A-I) Expression of cdh5 (A,D,G), flt1 (B,E,H) and flt4 (C,F,I) detected by in situ hybridization (dorsal views). Arrowheads indicate the venous angioblasts. All angioblasts (A) and ECs of the arteries and veins (D,G) express cdh5. All angioblasts express flt1 (B) and flt4 (C), before flt1 expression becomes downregulated in venous ECs (E,H) and flt4 becomes downregulated in arterial ECs (F,I). (J-L) Double fluorescent in situ hybridization for flt1 (red, J,K) and flt4 (green, J,L) shows that individual angioblasts express flt1 and flt4 mRNA at the same time (at 20 hpf these are located in the veins, J).