
Fig. 3
- ID
- ZDB-IMAGE-130213-6
- Genes
- Publication
- Barreto-Valer et al., 2012 - Modulation by Cocaine of Dopamine Receptors through miRNA-133b in Zebrafish Embryos
- All Figures
- Figures for Barreto-Valer et al., 2012
|
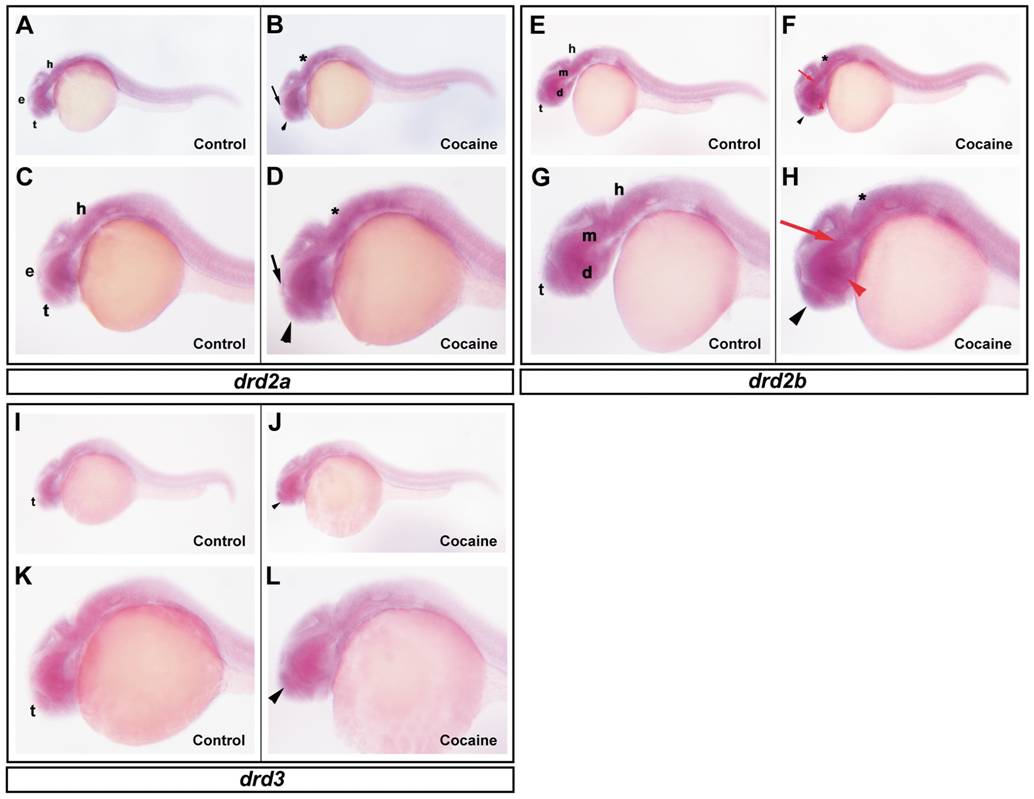
Fig. 3 Effects of cocaine on the spatial distribution of drd2a, drd2b and drd3.
Lateral view showing the expression of drd2a in embryos of 24 hpf. Control group (A and C) and cocaine group (B and D). drd2a is expressed in the epiphysis (e), tegmentum (t) and hindbrain (h) (A and C). Embryos exposed to cocaine (B and D) show an increase in the epiphysis (black arrow), tegmentum (black arrow head) and hindbrain (asterisk). Expression of drd2b in zebrafish embryos at 24 hpf. Control group (E and G) and cocaine group (F and H). drd2b is expressed in the tegmentum (t), diencephalon (d), mesencephalon (m) and in hindbrain (h) regions. Exposure to cocaine slightly increased the expression of drd2b in the regions mentioned (black arrow head, red arrow head, red arrow and asterisk, respectively). drd3 expression in zebrafish embryos at 24 hpf. Control group (I and K) and cocaine group (J and L). The expression of drd3 is seen mainly in tegmentum (t). Exposure to cocaine increased the expression of drd3 in tegmentum (black arrow head). Scale bars = 300 μm and 6X of magnification (A, B, E, F, I and J); 250 μm and 12X magnification (C, D, G, H, K and L). d: diencephalon (red arrow head), e: epiphysis (black arrow); h: hindbrain (asterisk); m: mesencephalon (red arrow); t: tegmentun (black arrowhead).