
|
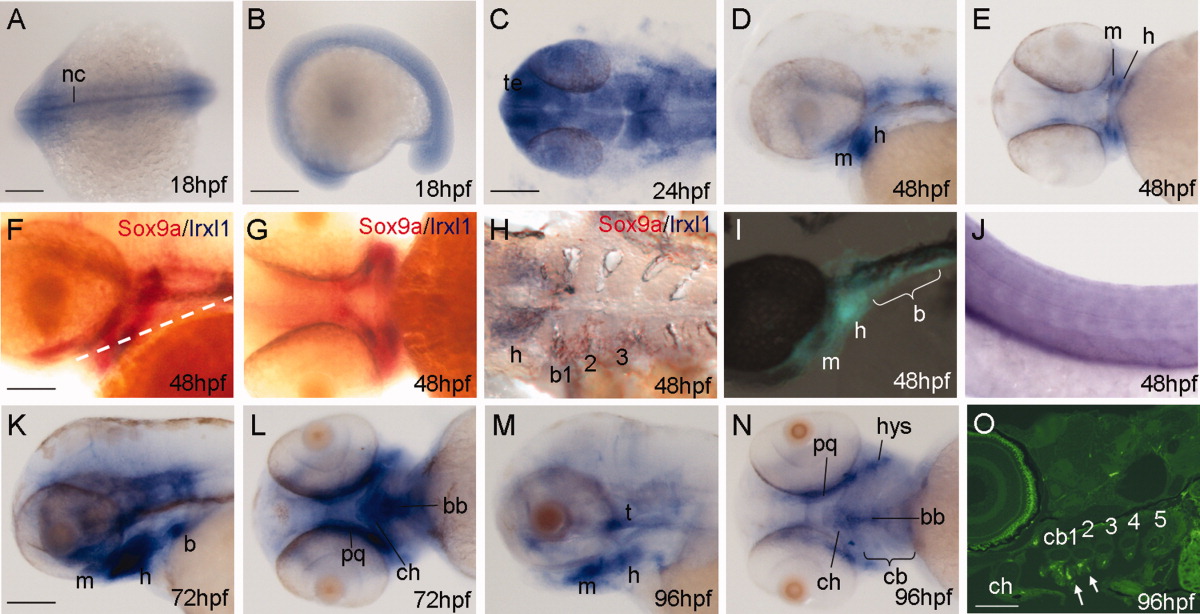
Fig. 3 Spatial expression of irxl1 during zebrafish development. A-H,J-N: Whole-mount in situ hybridization of embryos at 18-96 hours postfertilization (hpf) using a probe corresponding to the first five exons of irxl1 (recognizes both a and b isoforms) (A,B,D-H,J-N) or a probe corresponding to the 3′-untranslated region of irxl1a (C). I,O: Immunofluoresence staining using an anti-irxl1 antibody. I: Whole-mount embryo at 48 hpf. O: Cryosection at 96 hpf. F-H: Double labeling with irxl1 (blue) and sox9a (red) probes. H: Coronal section along the plane indicated by the dashed line in F. A,C: Dorsal views. B,D,F,I,J,K,M,O: Lateral views. E,G,L,N: Ventral views. b, branchial arch; bb, basibranchial; cb, ceratobranchial; ch, ceratohyal; h, hyoid arch; hys, hyosymplectic; m, mandibular arch; nc, notochord; pq, palatoquadrate; te, telencephalon; t, trabeculae. Scale bars = 300 μm in A,B, 100 μm in C-E,K-O, 60 μm in F-J.