
|
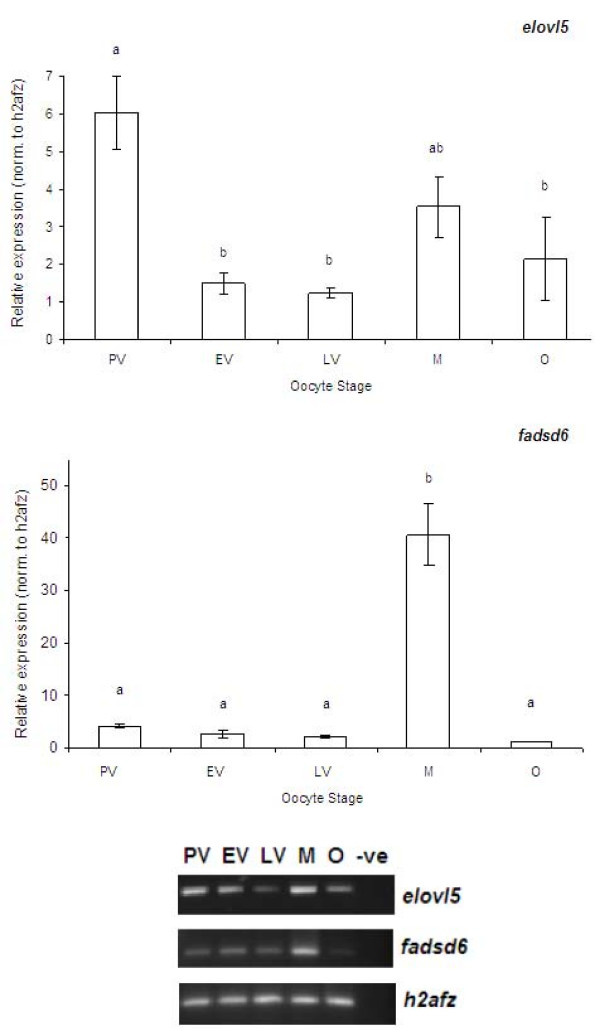
Fig. 3 Expression of elovl5 and fadsd6 normalized to h2afz during the zebrafish follicles development from PV to ovulation stage. PV represents pre-vitellogenic stage, EV represents early and mid-vitellogenic stage, LV represents fully-grown but immature stage, M represents matured oocyte stage and O represents ovulated oocyte stage. - ve represents negative control, with sterile water as template for RT-PCR. Each value represents mean ± SEM of three PCR runs at the significant level P < 0.05 using Tukey's HSD. Mean values with different alphabets are significantly different. Representative of the electrophoretic images of RT-PCR is shown at the lower panel.