
|
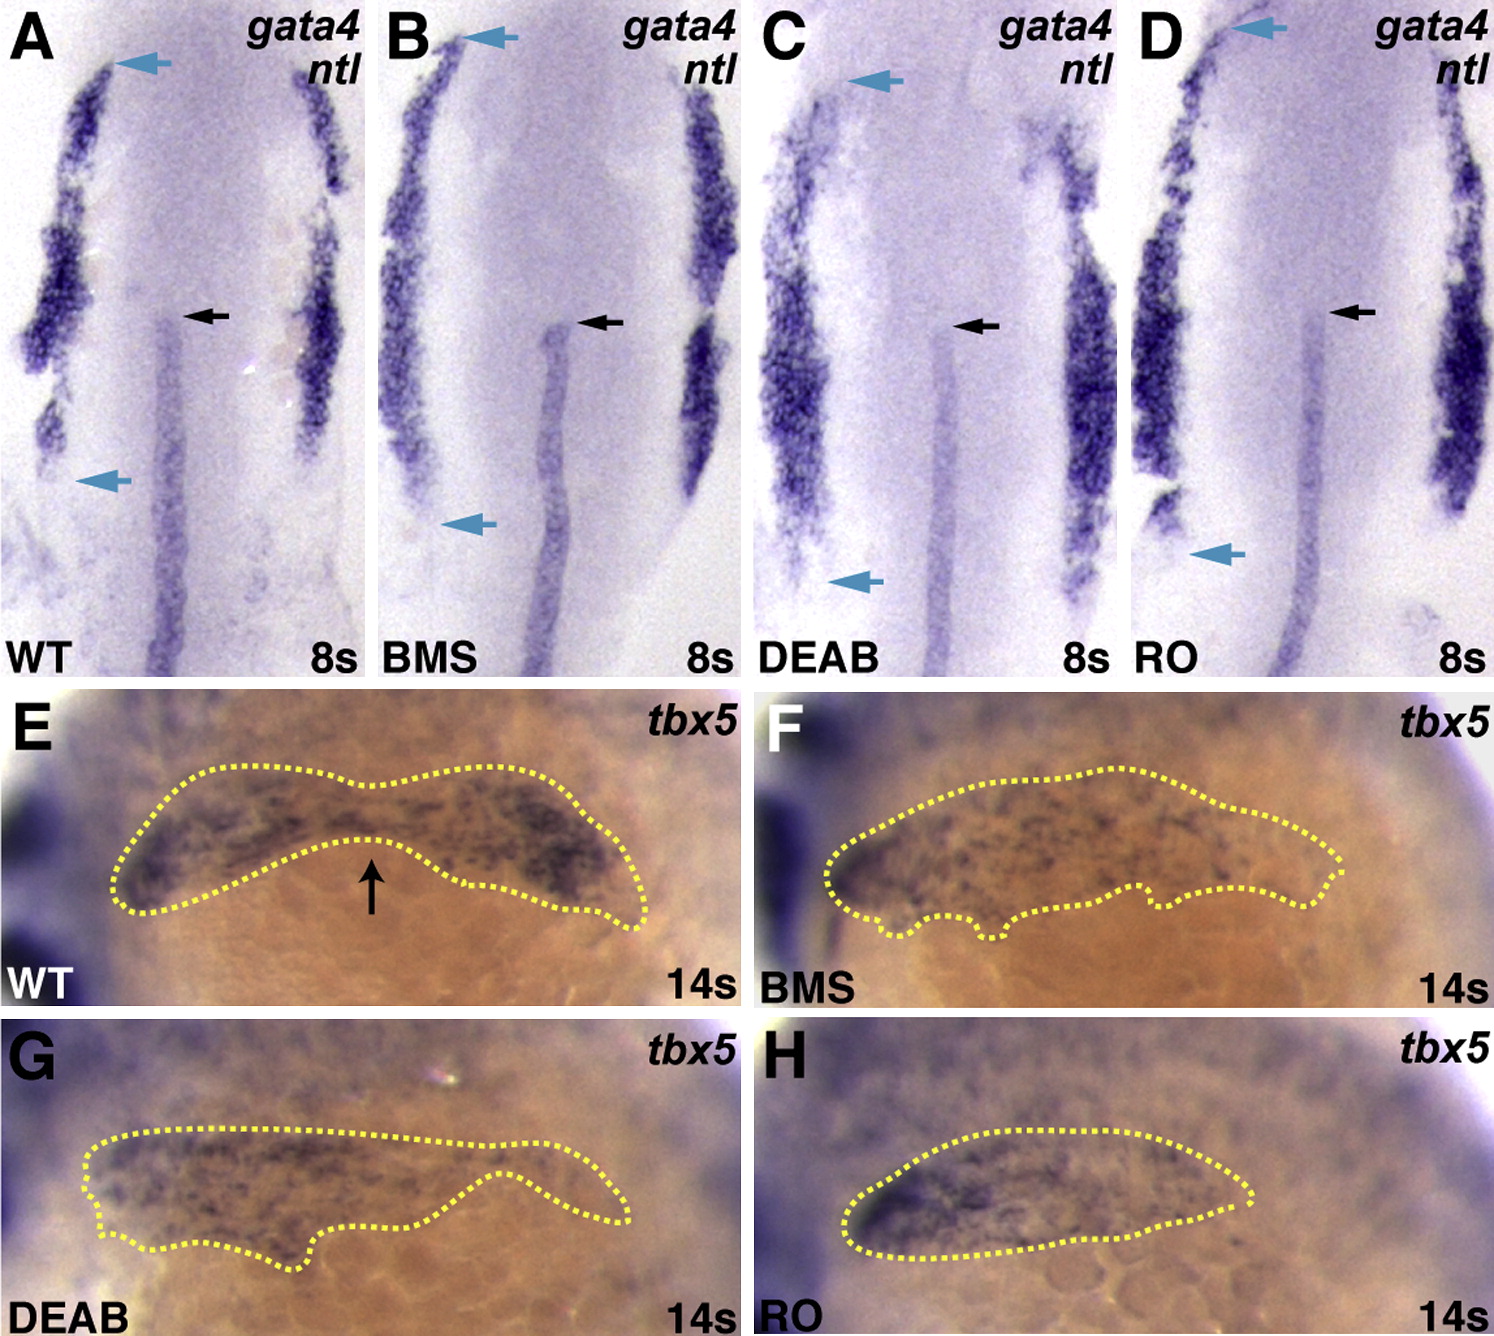
Fig. 4 Altered Expression of gata4 and tbx5 in Embryos Deficient in RA Signaling
(A–D) Expression at the 8 somite stage of gata4 and ntl in WT, BMS-treated, DEAB-treated, and RO-treated embryos; dorsal views, anterior to the top. When RA signaling is reduced, the total extent of gata4 expression is longer (blue arrows). This shift in gata4 expression is most prominent posterior to the notochord tip (black arrow).
(E–H) Expression of tbx5 in WT, BMS-treated, DEAB-treated, and RO-treated embryos at the 12 somite stage; lateral views, anterior to the left. (E) In WT embryos at this stage, the total extent of tbx5 expression (yellow outline) is divided into two comparably sized populations; a black arrow indicates the separation point. (F–H) When RA signaling is reduced, the separation between populations is less evident.
Reprinted from Developmental Cell, 15(6), Waxman, J.S., Keegan, B.R., Roberts, R.W., Poss, K.D., and Yelon, D., Hoxb5b acts downstream of retinoic Acid signaling in the forelimb field to restrict heart field potential in zebrafish, 923-934, Copyright (2008) with permission from Elsevier. Full text @ Dev. Cell