
|
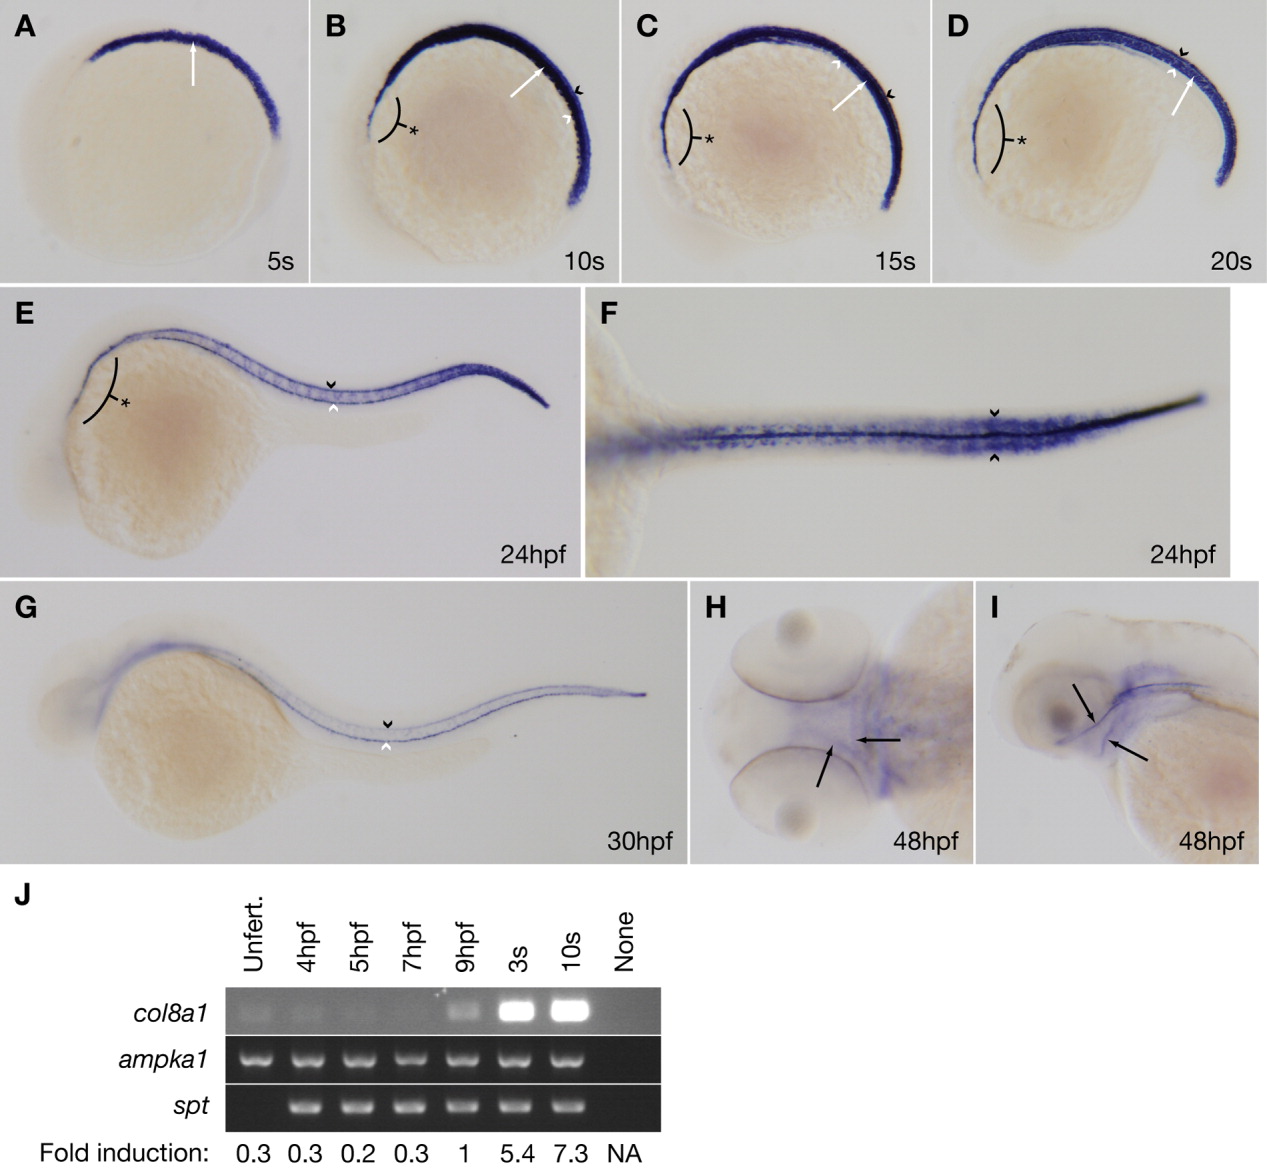
Fig. 4 col8a1 expression is consistent with the gulm208 phenotype. A-I: Whole-mount in situ hybridization for col8a1 was performed on wild-type embryos at various developmental stages. A: Lateral view of a five-somite embryo with col8a1 expression in the vacuolated notochord cells (arrow). B-D: Lateral views of 10- (B), 15- (C), or 20- (D) somite embryos with col8a1 expression in the notochord (arrow), floorplate (black arrowhead), hypochord (white arrowhead), and prechordal plate region (asterisk). E: Lateral view of an embryo at 24 hours postfertilization (hpf) with col8a1 expression in the floorplate (black arrowhead), hypochord (white arrowhead), and prechordal plate region (asterix). F: Dorsal view of an embryo at 24 hpf with col8a1 expression in the caudal somites (arrowheads). G: Lateral view of an embryo at 30 hpf with col8a1 expression in the floorplate (black arrowhead) and hypochord (white arrowhead). H: Dorsal view of an embryo at 48 hpf with col8a1 expression in jaw cartilages (arrows). I: Lateral view of an embryo at 48 hpf with col8a1 expression in jaw cartilages (arrows). J: reverse transcriptase-polymerase chain reaction (RT-PCR) for col8a1 at the indicated developmental stages. As controls, maternally-expressed 5′-AMP-activated protein kinase catalytic subunit alpha-1 (ampka1) and zygotically expressed spadetail (spt) were amplified in parallel (Griffin et al.,[1998]; Wagner et al.,[2004]). The fold induction of col8a1 relative to ampka1 is noted. Unfert, unfertilized; NA, not applicable.