
IMAGE
Fig. 5
Image
|
Figure Caption
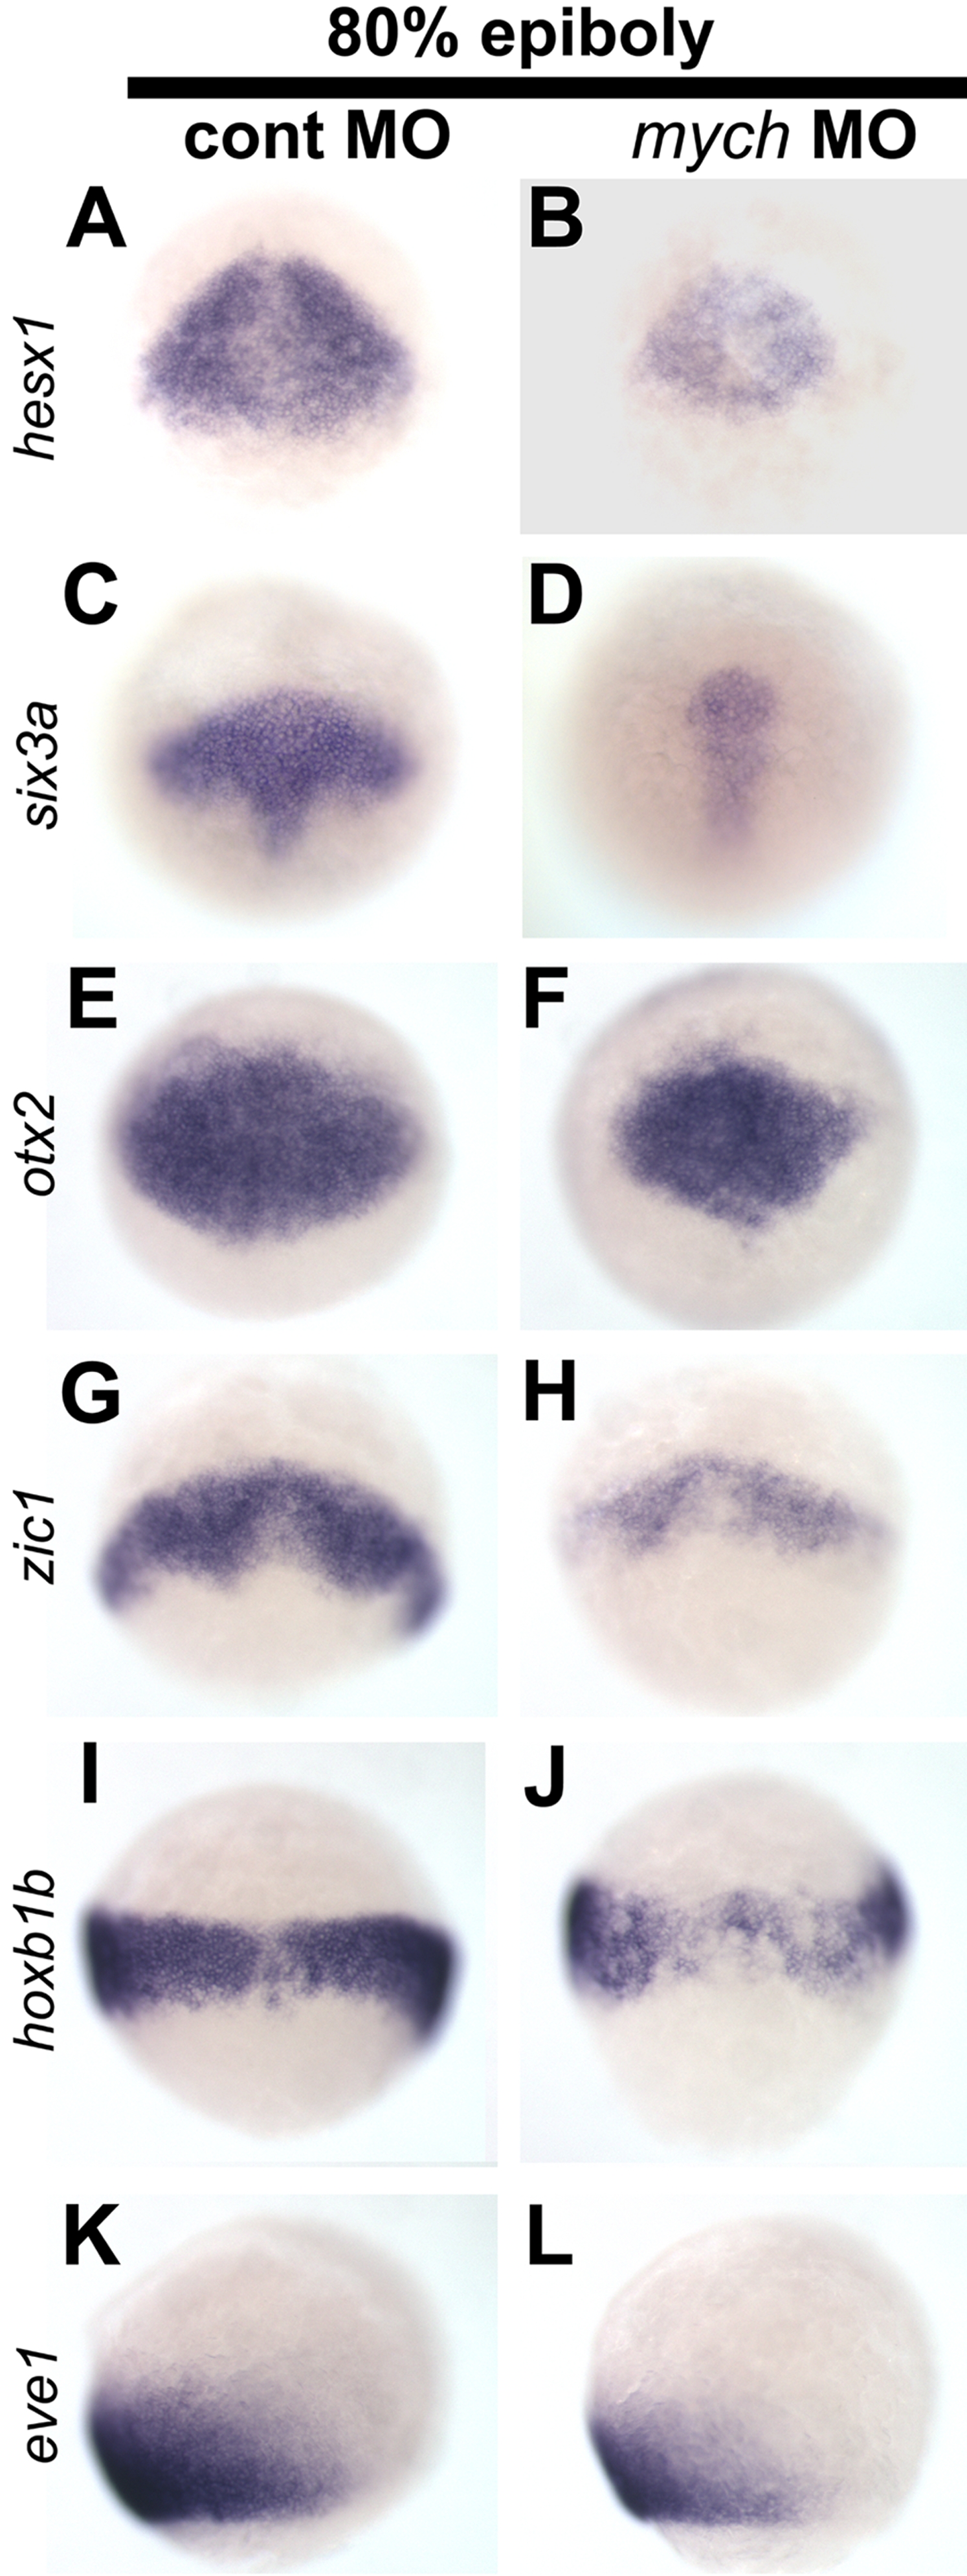
Fig. 5
Reduced expression of early anterior brain markers after mych MO injection.
A–J. Dorsal views (A–J) and lateral views (K–L) of control MO-injected (A,C,E,G,I,K) and mych UTR MO-injected embryos (B,D,F,H,J,L) at the 80% epiboly stage. The probes are indicated.
Figure Data
Acknowledgments
This image is the copyrighted work of the attributed author or publisher, and
ZFIN has permission only to display this image to its users.
Additional permissions should be obtained from the applicable author or publisher of the image.
Open Access
Full text @ PLoS One