
|
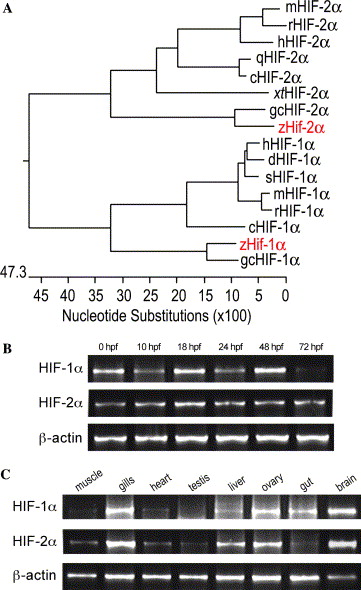
Fig. 1 Phylogenetic tree and expression of hif-1α and hif-2α during embryonic development. (A) Phylogenetic tree resulting from CLUSTAL analysis of HIF protein sequences. Horizontal lines indicate the degree of relatedness. Sequences are from human (h), mouse (m), rat (r), quail (q), chicken (c), Xenopus tropicalis (xt), grass carp (gc), dog (d), squirrel (s) and zebrafish (z). (B) Expression of hif-1α and hif-2α at different stages of development as assayed by RT-PCR from total RNA prepared from the indicated stages. hif-1α and hif-2α are expressed in all the stages analyzed. (C) Expression of hif-1α and hif-2α in adult tissues. Total RNA was prepared from the indicated tissues from adult fishes (one year old); both genes are expressed in all adult tissues analyzed, although at variable levels. As an internal control, expression of β-actin was assessed in the same samples (lower panel in B and C).
Reprinted from Gene expression patterns : GEP, 7(3), Rojas, D.A., Perez-Munizaga, D.A., Centanin, L., Antonelli, M., Wappner, P., Allende, M.L., and Reyes, A.E., Cloning of hif-1alpha and hif-2alpha and mRNA expression pattern during development in zebrafish, 339-345, Copyright (2007) with permission from Elsevier. Full text @ Gene Expr. Patterns