
|
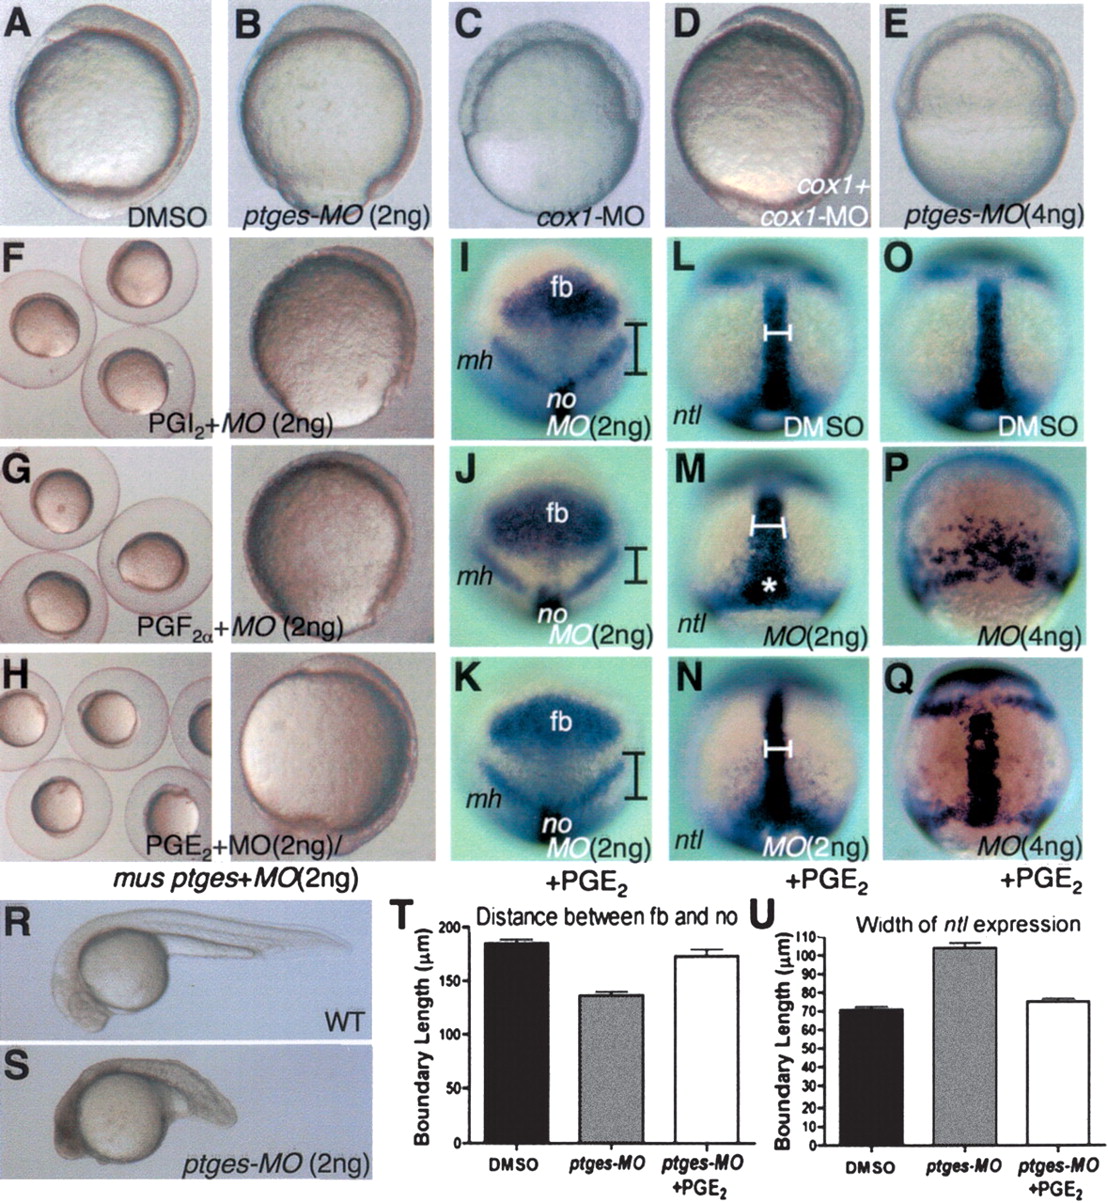
Fig. 2 Ptges-deficient embryos exhibit gastrulation defects that are suppressed by coincubation with PGE2. (A-H) Lateral view, dorsal to the right. (I-K) Animal view, dorsal to the bottom. (L-Q) Dorsal view, anterior to the top. (R,S) Lateral view, anterior to the left. (I-K) Boundaries indicate the distance from the posterior end of the forebrain to the anterior end of the notochord. (L-Q) Boundaries indicate the width of the notochord. (A,I,L,O) Control embryos treated with DMSO. (B,F-H,J,K,M,N,S) Embryos injected with 2 ng of ptges-MO2. (E,P,Q) Embryos injected with 4 ng of ptges-MO2. (C,D) Embryos injected with 10 ng of cox1-MO. (D) Embryos coinjected with cox1-MO (10 ng) and cox1 RNA (50 pg). (F) Embryos injected with 2 ng of ptges-MO2 + PGI2. (G) Embryos injected with 2 ng of ptges-MO2 + PGF2α. (H,K,N) Embryos injected with 2 ng of ptges-MO2 + PGE2. (Q) Embryos injected with 4 ng of ptges-MO2 + PGE2. (H) Embryos coinjected with ptges-MO2 (2 ng) + mouse ptges RNA (100 pg). (I-K) Expression patterns of six3b, pax2.1. (L-Q) Expression pattern of no tail. (T) Quantitative analyses of the distance between the forebrain (fb) and notochord (no) in DMSO, ptges-MO2, and ptges-MO2 + PGE2 (n = 10 per each group). (U) Quantitative analyses of width of ntl expression in DMSO, ptges-MO2, and ptges-MO2 + PGE2 (n = 10 per each group). (fb) Forebrain; (mh) mid-hindbrain; (no) notochord. The white star marks the blastopore to illustrate delayed epiboly. For details see text.