
|
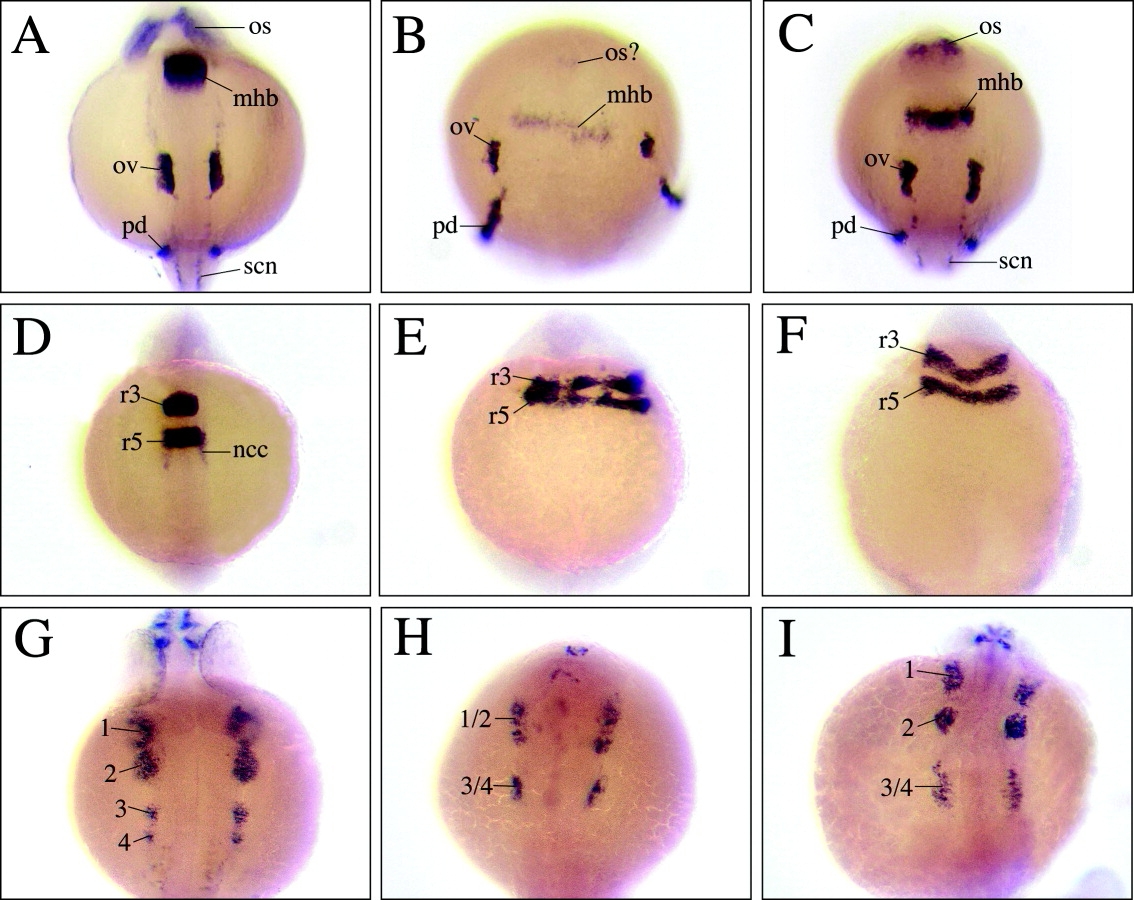
Fig. 5
Molecular characterization of acvr2a and acvr2b morphants. All panels are dorsal views with anterior to the top. A: At the 12-somite stage, pax2a is expressed in the optic stalk (os), midbrain-hindbrain boundary (mhb), otic vesicle (ov), spinal cord neurons (scn), and in the pronephric duct (pd) in wild-type (wt) embryos. B: The acvr2a MOs exhibited reduced or absent pax2a expression in the optic stalk, midbrain-hindbrain boundary, and spinal cord neurons, whereas otic vesicle and pronephric duct tissues exhibited fairly normal pax2a expression. C: The acvr2b MOs exhibited slightly reduced pax2a expression in the optic stalk and midbrain-hindbrain boundary, whereas pax2a expression in otic vesicle, pronephric duct and spinal cord neurons appeared normal. D: At the 12-somite stage, krox20 is normally expressed in rhombomere 3 (r3) and rhombomere 5 (r5) and in cranial neural crest (CNC) cells migrating from r5. E,F: The acvr2a morphants exhibited mediolaterally expanded and disrupted krox20 expression (E), whereas acvr2b morphants exhibited mispatterned, chevron shaped neurepithelium (F). G: In 24 hours postfertilization (hpf) wt embryos, dlx2 is expressed in the CNC of four discrete pharyngeal arches (1-4). H: In contrast, acvr2a MOs exhibited reduced CNC populations and fused first and second, and third and fourth CNC segments. I: The acvr2b MOs exhibited wt dlx2 expression levels in first and second pharyngeal arches, whereas third and fourth segments exhibited reduced dlx2 expression and appeared fused.