
Figure 8—figure supplement 2.
- ID
- ZDB-FIG-240603-110
- Publication
- Spikol et al., 2024 - Genetically defined nucleus incertus neurons differ in connectivity and function
- Other Figures
-
- Figure 1—figure supplement 1.
- Figure 1—figure supplement 1.
- Figure 1—figure supplement 2.
- Figure 2—figure supplement 1.
- Figure 2—figure supplement 1.
- Figure 2—figure supplement 2.
- Figure 3.
- Figure 4.
- Figure 5.
- Figure 6—figure supplement 1.
- Figure 6—figure supplement 1.
- Figure 7.
- Figure 8—figure supplement 1.
- Figure 8—figure supplement 1.
- Figure 8—figure supplement 2.
- Figure 8—figure supplement 3.
- All Figure Page
- Back to All Figure Page
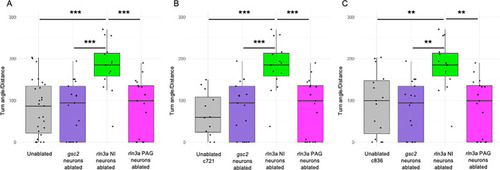
Loss of Ratio of the total size, in degrees, of all calculated angles during the first 115 s of the recording, divided by total distance traveled in millimeters. ( |