|
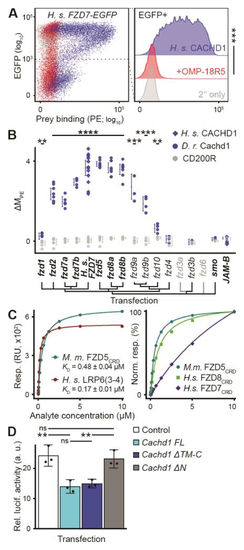
CACHD1 physically interacts with Wnt receptors LRP6 and FZD family members. (A) (Left) Representative scatter plot of flow cytometry testing binding of FLAG-tagged CACHD1 prey protein to human FZD7-EGFP transiently transfected HEK293E cells detected by means of phycoerythrin (PE)-conjugated secondary antibody. (Right) Without (blue) or with (red) preincubation with antibody to Frizzled OMP-18R5; secondary only negative control (gray). n = 3; one-tailed paired t test (DF = 2, t = 9.53, *** P = 0.0054). (B) Dot plot of human (blue diamonds) or zebrafish (blue circles) Cachd1 or negative control CD200R (gray) prey protein binding (standardized as ΔMPE (supplementary materials, materials and methods) to cells transiently transfected with EGFP fusion protein constructs indicated (transfections verified by means of antibody labeling are indicated in bold). Each dot indicates a single experiment; horizontal bars indicate the mean, and error bars indicate 95% confidence intervals. One way Welch test of means (Cachd1 prey versus CD200R prey, not assuming equal variances; F = 132.32, DFnum = 30.00, DFdenom = 34.67, P = 5.09 × 10⁻²⁸), post hoc pairwise t tests with non-pooled standard deviations, Benjamini-Hochberg correction for multiple testing. Only statistically significant differences between Cachd1 and CD200R prey for individual transfections are presented here for clarity; ** 0.05 ≥ P > 0.01, *** 0.01 ≥ P > 0.005, **** P ≤ 0.005. (C) SPR-based determination of KD (left) for mouse CACHD1ECD analyte binding to immobilized mouse FZD5CRD (cyan) or human LRP6P3E3P4E4 (3-4, red), and normalized response curves (right) for different CACHD1ECD:FZDCRD interactions. RU, response units. (D) TOPFlash responses of HEK293 cells to WNT3A treatment after transfection with a control plasmid (white) or plasmids containing full length rodent Cachd1 (cyan), Cachd1 extracellular domain only (blue; ΔTM-C), or Cachd1 transmembrane and intracellular domains only (gray; ΔN). Mean responses are shown (n = 3 experiments; black dots indicate mean of quadruple technical replicates in each experiment); error bars idicate 95% confidence intervals. One way Welch test of means (not assuming equal variances; F = 13.202, DFnum = 3.00, DFdenom = 4.19, P = 0.014), post hoc pairwise t tests with non-pooled standard deviations, Benjamini-Hochberg correction for multiple testing. ns, P > 0.1, ** 0.05 ≥ P > 0.01.
|