
- Title
-
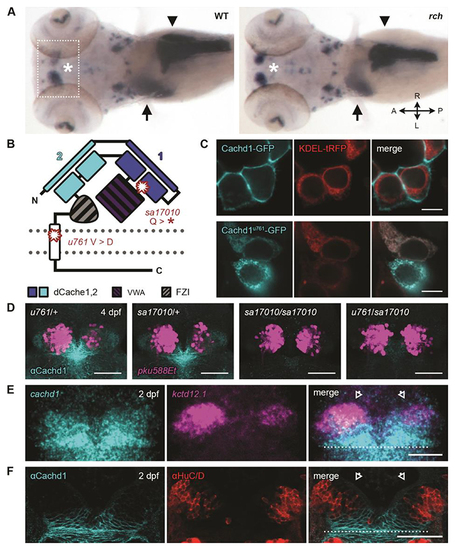
Cachd1 interacts with Wnt receptors and regulates neuronal asymmetry in the zebrafish brain
- Authors
- Powell, G.T., Faro, A., Zhao, Y., Stickney, H., Novellasdemunt, L., Henriques, P., Gestri, G., Redhouse White, E., Ren, J., Lu, W., Young, R.M., Hawkins, T.A., Cavodeassi, F., Schwarz, Q., Dreosti, E., Raible, D.W., Li, V.S.W., Wright, G.J., Jones, E.Y., Wilson, S.W.
- Source
- Full text @ Science
( |
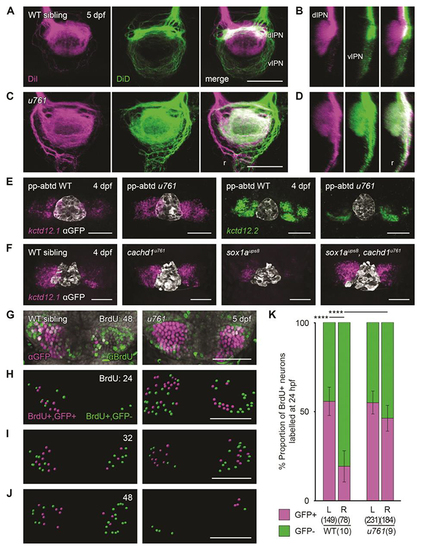
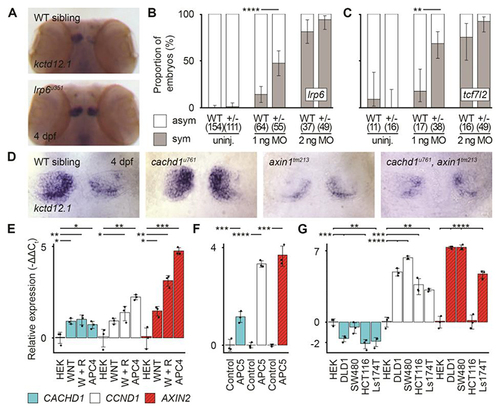
Loss of function of ( |
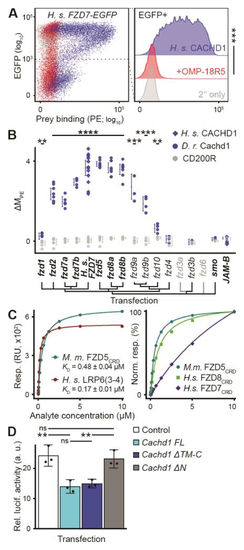
CACHD1 physically interacts with Wnt receptors LRP6 and FZD family members. ( |
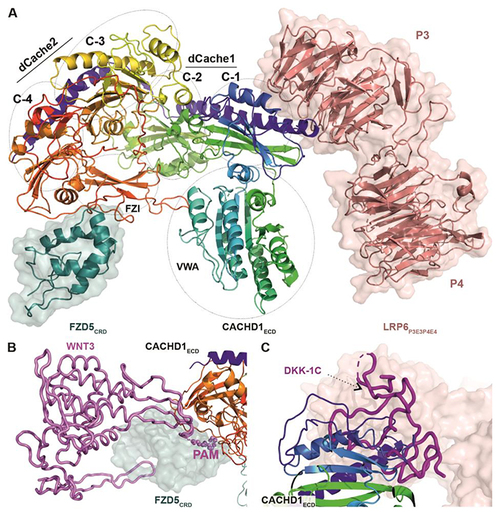
CACHD1 forms a ternary complex with FZD5 and LRP6. ( |
( |