
Fig. 1
- ID
- ZDB-FIG-240405-106
- Publication
- Weinberger et al., 2024 - Distinct epicardial gene regulatory programs drive development and regeneration of the zebrafish heart
- Other Figures
- All Figure Page
- Back to All Figure Page
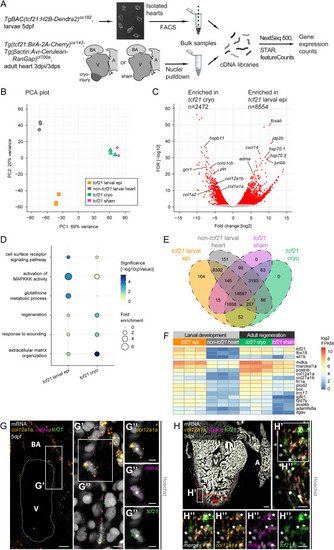
Gene expression programs in the developing and regenerating zebrafish epicardia are distinct (A) Overview of the RNA sequencing workflow. (B) Principal-component clustering of transcriptome samples. (C) Differential gene expression analysis of tcf21 larval epi versus tcf21 cryo. Shown are log2-transformed expression fold changes and Benjamini-Hochberg-adjusted Wald test p values. Significantly enriched genes (adjusted p value < 0.05) are colored in red. (D) GO term over-representation of genes enriched in tcf21 larval epi (versus tcf21 cryo, left column) and genes enriched in tcf21 cryo (right column). Bubble size depicts the magnitude of statistical enrichment, color significance. (E) Venn diagram depicting the overlap of gene expression enrichment across conditions. Indicated are the numbers of genes contained in each intersection. (F) Expression of genes enriched in tcf21 larval epi versus non-tcf21 larval heart and enriched in tcf21 cryo versus tcf21 sham. (G) mRNA staining of col12a1a (orange), mdka (magenta), and tcf21 (green) in a 5 dpf heart. (G′ and G′′) A nucleus (asterisk) in the epicardial region surrounded by col12a1a, mdka, and tcf21 transcripts. (H) mRNA staining of col12a1a (orange), mdka (magenta), and tcf21 (green) in a 3-dpi heart. Ia, injury area. (H′ and H′′) Single nuclei (asterisks) in the epicardial region surrounded by col12a1a, mdka, and tcf21 transcripts. Scale bars: 100 μm in (H); 20 μm in (G), (H′), and (H′′); and 5 μm in (G′) and (G′′). Color channels adjusted separately for brightness/contrast. (G) and (H) are single optical sections. dpf, days post fertilization; dpi, days post-injury; V, ventricle; A, atrium; BA, bulbus arteriosus. Number of biological replicates analyzed: tcf21 larval epi, n = 3; non-tcf21 larval heart, n = 3; tcf21 cryo, n = 3; tcf21 sham n = 2. See also Figure S1. |
Reprinted from Developmental Cell, 59(3), Weinberger, M., Simões, F.C., Gungoosingh, T., Sauka-Spengler, T., Riley, P.R., Distinct epicardial gene regulatory programs drive development and regeneration of the zebrafish heart, 351-367.e6, Copyright (2024) with permission from Elsevier. Full text @ Dev. Cell