
Fig. 6
- ID
- ZDB-FIG-240328-7
- Publication
- Giommi et al., 2023 - The probiotic SLAB51 as agent to counteract BPA toxicity on zebrafish gut microbiota -liver-brain axis
- Other Figures
- All Figure Page
- Back to All Figure Page
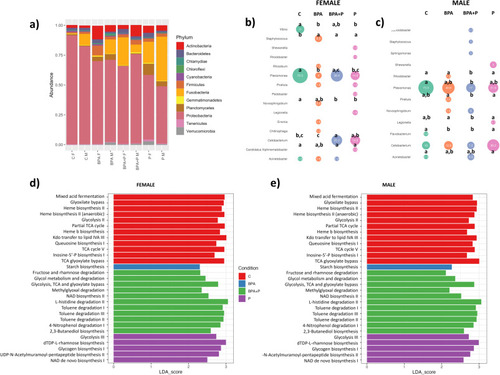
Microbiota analysis. a) Stacked bar chart representing the relative abundance of bacterial phyla in both sexes (only taxa contributing to at least 1 % of the total composition are displayed). Bubble chart showing genera abundance analysis in different groups (abundance >1 % of the total composition are displayed), determined by DESeq2 and adjusted for multiple comparisons (Benjamini-Hochberg) for b) females and c) males respectively (n = 6 for C both females and males and n = 3 for BPA, BPA + P and P for both females and males). Bubble size indicates higher (big) or lower (small) absolute abundance of bacterial genera. Letter “a” has been assigned to the highest value. Groups with the same letters do not present statistically significant differences among them, whereas groups with different letters do present statistically significant differences among them (P < 0.05). Groups labeled with two letters do not present statistically significant differences with other groups presenting either of them. LEFSa pathway prediction analysis based on gut microbial colonization data of d) females and e) males. |