
Fig. 2
- ID
- ZDB-FIG-240328-3
- Publication
- Giommi et al., 2023 - The probiotic SLAB51 as agent to counteract BPA toxicity on zebrafish gut microbiota -liver-brain axis
- Other Figures
- All Figure Page
- Back to All Figure Page
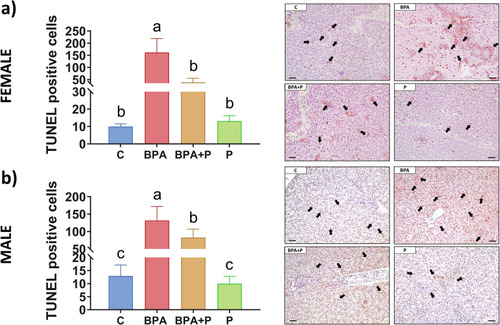
Liver TUNEL. TUNEL positive cells in a) female and b) male liver in the experimental groups. Data are reported as mean ± standard deviation (SD) (n = 3). Groups with the same letters do not present statistically significant differences among them, whereas groups with different letters do present statistically significant differences among them (P < 0.05). Letter “a” has been assigned to the highest value. Microphotographs show representative images of TUNEL assay in the female (upper) and male (lower) liver sections in which the TUNEL positive cells are indicated by black arrows. Scale bar = 200 μm. |