
Fig. 5
- ID
- ZDB-FIG-240328-6
- Publication
- Giommi et al., 2023 - The probiotic SLAB51 as agent to counteract BPA toxicity on zebrafish gut microbiota -liver-brain axis
- Other Figures
- All Figure Page
- Back to All Figure Page
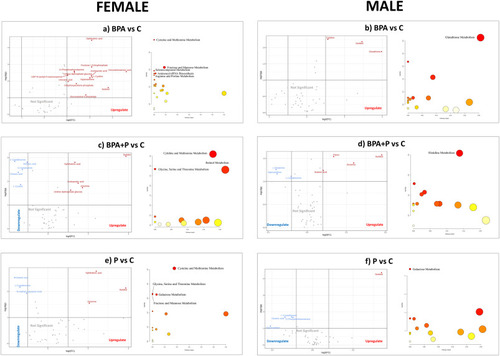
Liver metabolomic analysis. Volcano plot and pathway analysis of BPA vs C, BPA + P vs C and P vs C in a,c,e) female and b,d,f) male (n = 5 for both C and BPA + P, n = 6 for both BPA and P in female, n = 4 for all groups in male). In volcano plot, up-regulated metabolites are shown in red, down-regulated metabolites are shown in blue and not-significant metabolites are shown in grey. The X axis stands for the relevance of the metabolite within the pathway, whereas the Y for the significance of the pathway in the comparison. The color of the dots represents the level of statistical significance, red being the most statistically significant and white the least. The width of the dots indicates the relevance of the metabolites inside that pathway, the wider they are, the greater relevance they have. |