
Fig. 8
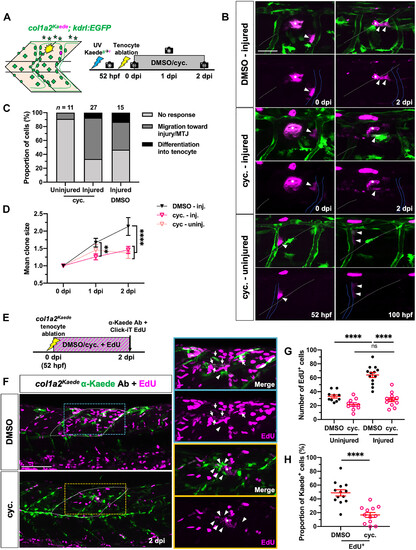
Hh signaling regulates fibroblast proliferation during tenocyte regeneration. (A) Experimental protocol for single-cell clonal analysis of perivascular fibroblasts in DMSO- or cyclopamine-treated embryos. (B) Representative images of photoconverted perivascular fibroblasts and their progeny in injured DMSO- and cyclopamine-treated embryos at 0 and 2 dpi and uninjured cyclopamine-treated embryos at equivalent stages (52 and 100 hpf). Labeled clones (arrowheads) can be seen migrating from the ISVs (blue lines) to the injury site (asterisks) in both injury conditions but are retained along the ISVs in uninjured cyclopamine-treated fish. White dotted lines indicate the MTJs. (C and D) Overall perivascular fibroblast response (C) and clone size (D) in DMSO- or cyclopamine-treated embryos after tenocyte ablation. n = 15 (injured) DMSO-treated embryos; 11 (uninjured) and 27 (injured) cyclopamine-treated embryos. (E) Timeline for concurrent EdU incorporation and drug treatment after injury. (F) Representative images from control and drug-treated embryos from (E). Most fibroblasts (labeled by col1a2Kaede) surrounding the injury site (asterisks) in DMSO-treated embryos at 2 dpi were EdU+ (arrows), whereas most injury-responsive fibroblasts in cyclopamine-treated embryos showed no EdU labeling (arrowheads). EdU-labeled cells in the dorsal half of two somites immediately surrounding the injury site (white dotted lines) were counted as shown in (G) and (H). (G and H) Quantification of total EdU+ cells (G) and proportion of EdU+ fibroblasts (H) at injured and uninjured regions in DMSO- and cyclopamine-treated embryos. n = 10 (uninjured) and 13 (injured) MTJs from 13 DMSO-treated embryos; 10 (uninjured) and 12 (injured) MTJs from 12 cyclopamine-treated embryos. All data are plotted as mean ± SEM. Statistics: Mann-Whitney U test [(G) and (H)] and Sidak’s multiple comparisons (D). Significance: ns, P > 0.05; **P < 0.01; ****P < 0.0001. Asterisks denote injury site in all images. Scale bars, 100 μm (F) and 25 μm (B). |