
- Title
-
Single-cell analysis reveals distinct fibroblast plasticity during tenocyte regeneration in zebrafish
- Authors
- Rajan, A.M., Rosin, N.L., Labit, E., Biernaskie, J., Liao, S., Huang, P.
- Source
- Full text @ Sci Adv

scRNA-seq reveals heterogeneity and differential plasticity in sclerotome-derived fibroblasts. (A) Sample preparation pipeline for scRNA-seq of mCherry+ cells from 52 hpf nkx3-1NTR-mCherry zebrafish trunks. (B) UMAP plot of the post-filtering scRNA-seq dataset. Dotted line indicates sclerotome-derived fibroblast clusters. (C) Proportion of ECM-related (matrisomal) transcripts detected per cell, grouped by cluster. Matrisome gene expression is enriched in sclerotome-derived fibroblast clusters (dotted line). (D) UMAP representation of subsetted fibroblast clusters from (B), with distinct fibroblast subtypes labeled. (E) Feature plots showing expression of a pan-fibroblast marker, pdgfra, and one marker for each cluster identified in (D). (F) Schematic depicting distribution of fibroblast subtypes from (D) in the zebrafish trunk, as determined in figs. S4 to S6. (G) RNA velocity analysis of fibroblast clusters. Stream and arrowheads indicate direction of differentiation trajectory. CVP, caudal vein plexus; DLAV, dorsal longitudinal anastomotic vessel; Fb, fibroblast; ISV, intersegmental vessel; MTJ, myotendinous junction; Scl, sclerotome. |

Zebrafish can regenerate trunk tenocytes after laser ablation. (A) Schematic representation of tenocyte ablation protocol and quantification shown in (B) to (F). (B) In situ hybridization for tenocyte markers, prelp (top) and tnmd (bottom), at 1, 2, and 4 dpi showing increased gene expression (arrowheads) around the injury region (asterisks) at 2 dpi. n = 9 to 13 embryos per probe at each stage. (C to F) Quantification of staining area and gap size in stained embryos as described in (A). (G) Experimental protocol to track tenocyte regeneration in live scxa:mCherry embryos. (H) Change in tenocyte number from 52 hpf to 4 dpi along injured and uninjured MTJs. (I) Quantification of gap between adjacent tenocytes at the injury site in each embryo from 0 to 4 dpi. (J) Representative images of one injured embryo from 52 hpf to 4 dpi, with several newly regenerated tenocytes (arrows) arising at the injured MTJ. Autofluorescent scar from laser ablation indicated by asterisks. n = 14 uninjured and 19 injured MTJs from 19 embryos. All data shown as mean ± SEM. Statistics: Mann-Whitney U test [(C) to (F)]; Sidak’s multiple comparisons (H). Significance: ns (not significant), P > 0.05; *P < 0.05; **P < 0.01; ***P < 0.001; ****P < 0.0001. Scale bars, 50 μm (B) and 25 μm (J). |

Sclerotome-derived fibroblasts give rise to new tenocytes after laser ablation. (A) Experimental timeline for fibroblast photoconversion and lineage tracing in col1a2Kaede; kdrl:EGFP embryos shown in (B) to (D). Ab, antibody; FISH, fluorescence in situ hybridization. (B) Representative images of one injured embryo from 52 hpf to 4 dpi. New Kaedered-positive fibroblasts (arrows) can be seen along the regenerating MTJ (dotted lines) from 1 to 4 dpi. n = 31 embryos. (C) Close-up view of a single Kaedered-positive fibroblast (arrows) at a regenerated MTJ (dotted lines) at 4 dpi. Depth projection (right) reveals several tenocyte-like processes (notched arrowheads) extending laterally from the cell. (D) Coimmunostaining and fluorescent mRNA in situ hybridization showing tenocyte marker tnmd expression (magenta) in the traced fibroblast (arrows) from (C). n = 51 of 64 cells from 21 embryos. Notched arrowheads indicate cell processes. (E) Protocol for Cre-mediated lineage tracing of sclerotome-derived fibroblasts after tenocyte ablation. (F) Representative images of a single injured embryo from 52 hpf to 4 dpi showing new mCherry+ tenocytes (arrows) at the regenerated MTJ. n = 12 embryos. Injury site is indicated by asterisks for all images. Scale bars, 25 μm [(B) and (F)] and 10 μm [(C) and (D)]. |
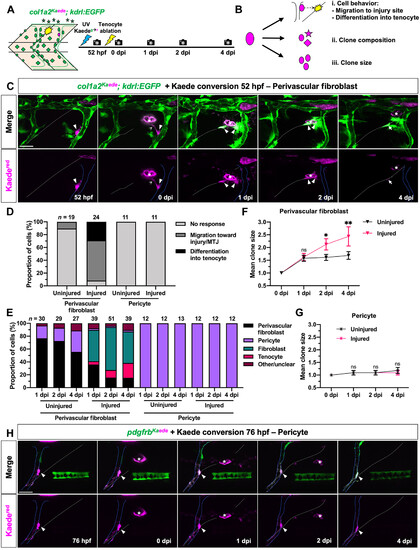
Perivascular fibroblasts but not pericytes respond to tendon injury. (A) Experimental protocol for clonal analysis of fibroblasts in col1a2Kaede; kdrl:EGFP embryos. A single fibroblast was converted from Kaedegreen to Kaedered fluorescence before tenocyte ablation, and injured fish were followed from 52 hpf to 4 dpi. (B) Three parameters quantified to describe the behavior of traced cells. (C) Representative images of a photoconverted perivascular fibroblast from 52 hpf to 4 dpi. The traced cell (magenta, arrowheads) can be seen extending processes (notched arrowheads), migrating away from the ISV (solid blue lines), and giving rise to a new tenocyte (arrows) at the regenerating MTJ (white dotted lines) in response to tenocyte ablation. (D) Graph summarizing overall response of photoconverted perivascular fibroblasts and pericytes in injured and uninjured embryos. n = 19 (uninjured) and 24 (injured) perivascular fibroblasts; 11 (uninjured) and 11 (injured) pericytes. (E) Fibroblast subtype composition of the total clonal population across all traced perivascular fibroblasts and pericytes in injured and uninjured embryos at 1 to 4 dpi. Total clonal population size at each stage indicated above the graph. (F and G) Mean clone size of traced perivascular fibroblasts (F) and pericytes (G) from 0 to 4 dpi. (H) Representative images of a single photoconverted pericyte (magenta, arrowheads) from 76 hpf to 4 dpi in injured pdgfrbKaede embryos. ISV and injured MTJ denoted by solid blue and dotted white lines, respectively. Data in (F) and (G) represented as mean ± SEM. Statistics: Sidak’s multiple comparisons [(F) and (G)]. Significance: ns, P > 0.05; *P < 0.05; **P < 0.01. Scale bars, 25 μm. |
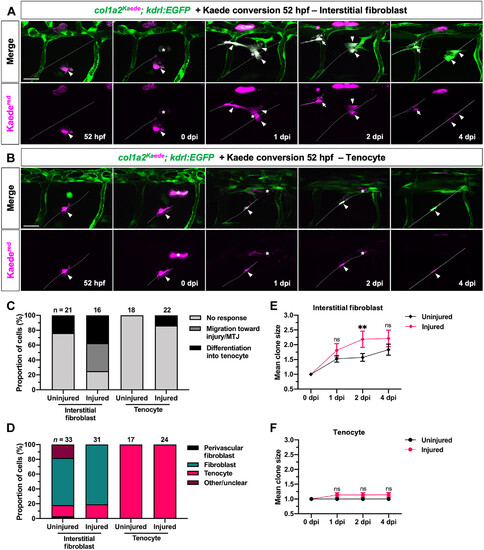
Interstitial fibroblasts but not tenocytes respond to tendon injury. (A and B) Representative images from clonal analysis of a single interstitial fibroblast (A) and tenocyte (B) in injured col1a2Kaede; kdrl:EGFP embryos, as described in Fig. 4A. The traced cells and their progeny (magenta) are indicated by arrowheads, and the new tenocyte is denoted by arrows. Dotted lines label MTJs, and injury site is denoted by asterisks in all images. (C to F) Quantification of interstitial fibroblast and tenocyte behavior, as depicted in Fig. 4B, showing overall response (C), clonal composition (D), and mean clone size [(E) and (F)] in injured and uninjured embryos. Note that the “differentiation into tenocyte” category for tenocyte clonal analysis graph in (C) represents rare cases where traced tenocytes underwent cell division to give rise to new tenocytes at the injured MTJ. n = 21 (uninjured) and 16 (injured) interstitial fibroblasts; 18 (uninjured) and 22 (injured) tenocytes. Data in (E) and (F) represented as mean ± SEM. Statistics: Sidak’s multiple comparisons [(E) and (F)]. Significance: ns, P > 0.05; **P < 0.01. Scale bars, 25 μm. |
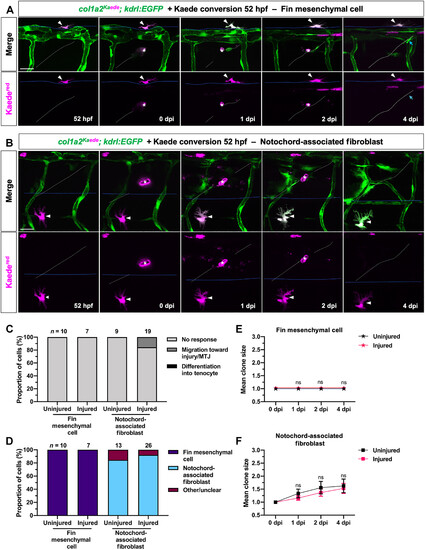
Fin mesenchymal cells and notochord-associated fibroblasts do not respond to tendon injury. (A and B) Clonal analysis of a single fin mesenchymal cell (A) and notochord-associated fibroblast (B) from 52 hpf to 4 dpi, as described in Fig. 4A. Both fibroblast subtypes (magenta, arrowheads) are retained within their respective anatomical locations after tendon injury. Blue lines indicate fin fold boundary in (A) and dorsal edge of the notochord in (B). The regenerating MTJ and injury site are indicated by white dotted lines and asterisks, respectively. Blue arrows in (A) indicate a newly regenerated Kaedered-negative tenocyte. (C to F) Quantification of fibroblast response (C), clonal composition (D), and clone size for fin mesenchymal cells (E) and notochord-associated fibroblasts (F) in injured versus uninjured embryos. Neither cell type showed notable activation after tendon injury. n = 10 (uninjured) and 7 (injured) fin mesenchymal cells; 9 (uninjured) and 19 (injured) notochord-associated fibroblasts. Data in (E) and (F) are shown as mean ± SEM. Statistics: Sidak’s multiple comparisons [(E) and (F)]. Significance: ns, P > 0.05. Scale bars, 25 μm. |

Inhibition of Hh signaling impairs tenocyte regeneration. (A) Whole-mount mRNA in situ hybridization showing up-regulation of Hh target gene ptc2 at the injury site (asterisks) at 1 and 2 dpi. n = 10 of 10 (1 dpi) and 18 of 28 (2 dpi) embryos. (B) Images of ptc2:Kaede; col1a2NTR-mCherry embryos at 1 and 2 dpi showing Kaede+mCherry+ fibroblasts (arrowheads) near the injury site (asterisks). n = 17 of 27 (1 dpi) and 16 of 25 (2 dpi) embryos. (C) Experimental protocol for drug treatment and staining of injured embryos. Injured embryos were incubated in DMSO or cyclopamine (cyc.) before fixation and in situ hybridization for prelp at appropriate stages. (D) Tenocyte marker prelp expression in DMSO- and cyclopamine-treated embryos at 1 and 2 dpi. Ectopic prelp expression (arrowhead) outside the MTJ can be seen in DMSO-treated but not cyclopamine-treated fish at 2 dpi. (E and F) Quantification of staining area (E) and gap size (F) for drug-treated embryos as described in Fig. 2A. n = 16 (1 dpi) and 28 (2 dpi) DMSO-treated embryos; 13 (1 dpi) and 28 (2 dpi) cyclopamine-treated embryos. (G) Drug treatment protocol for live scxa:mCherry embryos in (H) to (J). (H) Representative images of injured MTJs from DMSO- and cyclopamine-treated embryos at 0 and 2 dpi. A notable gap between tenocytes (green) can be seen in cyclopamine- but not DMSO-treated embryos. (I and J) Number of new tenocytes generated at injured and uninjured MTJs (I) and mean gap between tenocytes at the injury site (J) from 0 to 2 dpi in DMSO- and cyclopamine-treated embryos. n = 32 (DMSO) and 28 (cyclopamine) embryos. All data are plotted as mean ± SEM. Statistics: Mann-Whitney U test [(E) and (F)]; Sidak’s multiple comparisons [(I) and (J)]. Significance: ns, P > 0.05; **P < 0.01; ****P < 0.0001. Asterisks denote injury site in all images. Scale bars, 100 μm (A), 50 μm [(B) and (D)], and 25 μm (H). |
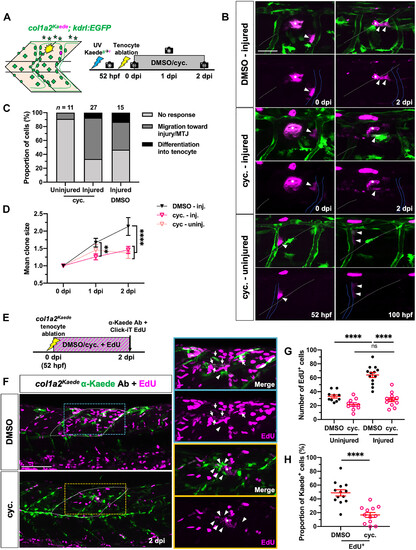
Hh signaling regulates fibroblast proliferation during tenocyte regeneration. (A) Experimental protocol for single-cell clonal analysis of perivascular fibroblasts in DMSO- or cyclopamine-treated embryos. (B) Representative images of photoconverted perivascular fibroblasts and their progeny in injured DMSO- and cyclopamine-treated embryos at 0 and 2 dpi and uninjured cyclopamine-treated embryos at equivalent stages (52 and 100 hpf). Labeled clones (arrowheads) can be seen migrating from the ISVs (blue lines) to the injury site (asterisks) in both injury conditions but are retained along the ISVs in uninjured cyclopamine-treated fish. White dotted lines indicate the MTJs. (C and D) Overall perivascular fibroblast response (C) and clone size (D) in DMSO- or cyclopamine-treated embryos after tenocyte ablation. n = 15 (injured) DMSO-treated embryos; 11 (uninjured) and 27 (injured) cyclopamine-treated embryos. (E) Timeline for concurrent EdU incorporation and drug treatment after injury. (F) Representative images from control and drug-treated embryos from (E). Most fibroblasts (labeled by col1a2Kaede) surrounding the injury site (asterisks) in DMSO-treated embryos at 2 dpi were EdU+ (arrows), whereas most injury-responsive fibroblasts in cyclopamine-treated embryos showed no EdU labeling (arrowheads). EdU-labeled cells in the dorsal half of two somites immediately surrounding the injury site (white dotted lines) were counted as shown in (G) and (H). (G and H) Quantification of total EdU+ cells (G) and proportion of EdU+ fibroblasts (H) at injured and uninjured regions in DMSO- and cyclopamine-treated embryos. n = 10 (uninjured) and 13 (injured) MTJs from 13 DMSO-treated embryos; 10 (uninjured) and 12 (injured) MTJs from 12 cyclopamine-treated embryos. All data are plotted as mean ± SEM. Statistics: Mann-Whitney U test [(G) and (H)] and Sidak’s multiple comparisons (D). Significance: ns, P > 0.05; **P < 0.01; ****P < 0.0001. Asterisks denote injury site in all images. Scale bars, 100 μm (F) and 25 μm (B). |

. Model of fibroblast plasticity and tendon regeneration in zebrafish. (A) Schematic showing distinct plasticity of different sclerotome-derived fibroblast populations in the zebrafish trunk at 52 hpf, including progenitor-like perivascular/interstitial fibroblasts, as well as specialized tenocytes, fin mesenchymal cells, and notochord-associated fibroblasts. During normal development, perivascular fibroblasts act as pericyte precursors, while interstitial fibroblasts function as tenocyte progenitors. By contrast, both perivascular and interstitial fibroblasts contribute to tenocyte regeneration upon tendon injury, while perivascular fibroblast–derived pericytes as well as specialized fibroblasts do not exhibit such regenerative plasticity. (B) Timeline of fibroblast response to tenocyte ablation. After tenocyte ablation, perivascular fibroblast–mediated tenocyte regeneration proceeds in three partially overlapping phases. First, perivascular fibroblasts are recruited to the injured MTJ from the vasculature between 0 and 1 dpi. Second, the activated fibroblasts then undergo one to two rounds of cell division in a Hh signaling–dependent manner starting at 1 dpi and concurrently up-regulate tenocyte marker genes, prelp and tnmd. Last, by 4 dpi, a subset of these differentiating fibroblasts matures into new tenocytes extending characteristic cellular processes into the newly regenerated MTJ. |