
Fig. S3
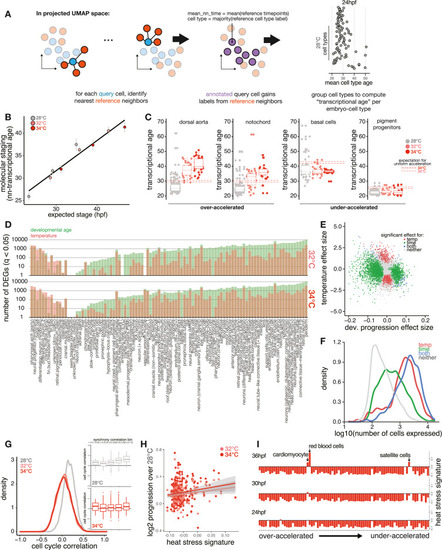
Temperature accelerates development non-uniformly across cell types, related to Figure 3 (A) Schematic showing method for computing transcriptional age of each cell through nearest-neighbor averaging of time point labels in the reference. (B) Scatterplot as in Figure 2B but showing how well whole-embryo staging by transcriptional data (nn-transcriptional age), rather than cell composition, predicts temperature-induced developmental acceleration. (C) Boxplots showing individual examples of cell types with greater-than-expected acceleration (left) and less-than-expected acceleration (right), with whole embryo expectation from Kimmel et al.24 for each temperature shown as dotted lines. (D) Bar plots showing the number of significantly (q < 0.05) differentially expressed genes in each cell type, separated by whether the gene has a significant association for developmental age (green) or temperature (red). Cell types along the x axis are ordered by the difference between the number of significant temperature genes vs. significant developmental age genes; the large majority shows more genes changing with developmental age rather than temperature. (E) Scatterplot showing significant genes separated by developmental age and temperature effects for a specific cell type, the notochord. Temperature and age coefficients are shown for each gene and are colored based on significant associations with each factor, neither, or both. (F) Density histogram showing that genes with significant associations with temperature tended to show higher expression levels than developmental age genes. (G) Density histogram of pairwise Pearson correlations for cell-cycle signature values across all cell-type pairs, with separate densities for each temperature. Inset shows boxplots of pairwise cell-cycle correlations grouped into cell-type pairs that showed lower or higher levels of developmental timing synchrony. (H) Scatterplot, as in Figure 3C, showing that the basal level of HSR signature in each cell type is not a strong predictor of that cell type’s developmental acceleration at 32°C or 34°C. (I) Bar plots showing the level of HSR signature induction for all cell types at 34°C; cell types on the y axis are ordered by relative developmental acceleration, with the most strongly accelerated types at the top, and columns for each time point. No induction of HSR signature is apparent in the most accelerated cell types. |
Reprinted from Cell, 186, Dorrity, M.W., Saunders, L.M., Duran, M., Srivatsan, S.R., Barkan, E., Jackson, D.L., Sattler, S.M., Ewing, B., Queitsch, C., Shendure, J., Raible, D.W., Kimelman, D., Trapnell, C., Proteostasis governs differential temperature sensitivity across embryonic cell types, 50155027.e125015-5027.e12, Copyright (2023) with permission from Elsevier. Full text @ Cell