
Fig. 4
- ID
- ZDB-FIG-240206-24
- Publication
- Accogli et al., 2023 - Clinical, neuroradiological and molecular characterization of mitochondrial threonyl-tRNA-synthetase (TARS2)-related disorder
- Other Figures
- All Figure Page
- Back to All Figure Page
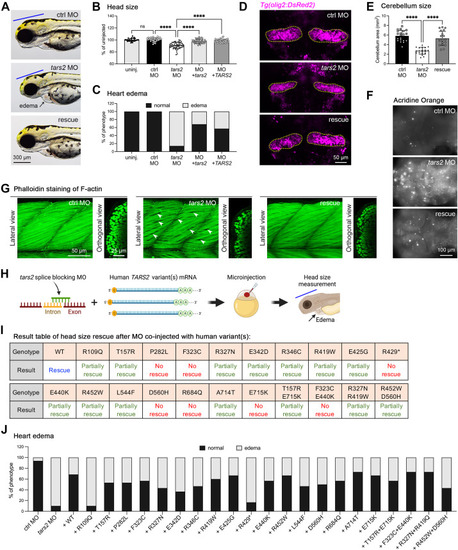
Functional testing of TARS2 variants in zebrafish. A. Representative images of an embryo injected with control MO (ctrl MO), tars2 MO, or tars2 MO rescue at 3 dpf. Lateral view, anterior to the left. The blue line indicates brain size, and the black arrow indicates heart edema. B. Quantification of head size from uninjected (n = 30 animals), ctrl MO (n = 31 animals), tars2 MO (n = 52 animals), tars2 MO + zebrafish tars2 RNA (+ tars2) (n = 41 animals), and tars2 MO + human TARS2 RNA (+ TARS2) (n = 52 animals) embryos at 3 dpf. Each symbol represents 1 animal. Values were calculated as percentage of the mean value of uninjected embryos. Error bars = mean ± SD. C. Quantification of heart edema. Animals were collected according to phenotype as shown in the image and calculated as the percentage of total animals. D. Representative cerebellum image of Tg(olig2:DsRed) of ctrl MO, tars2 MO, and tars2 MO rescue at 3 dpf. The red fluorescence color was replaced with pseudo-magenta color. E. Quantification of cerebellum area as indicated in (D). n = 10 animals. Error bars = mean ± SD. F. Acridine orange was used to stain brain in ctrl MO, tars2 MO, and tars2 MO rescue at 3 dpf. Scale bar = 100 μm. G. Confocal projections of phalloidin stained muscle fibers in the trunk region of ctrl MO, tars2 MO, and tars2 MO rescue. The anterior is shown to the left and dorsal at the top. The right panels show orthogonal views, dorsal to the top. H. Experimental approach for functionally characterizing human TARS2 variants. In vitro synthetic human TARS2 variant mRNA was mixed with zebrafish tars2 splice-blocking MO and microinjected into 1-cell stage embryos, followed by phenotypic evaluation at 3 dpf. The blue line indicates head size and the black arrow indicates heart edema. I. Summary of rescue results with the mean value for each group (from Figure S6). No rescue means the mean value of the group is close to the mean of tars2 MO group, and the statistic shows no significance compared with tars2 MO group. Partially rescued means the mean value of the group is higher than the mean of tars2 MO group but lower than the mean of uninjected control group, and the statistical difference shows significance compared with tars2 MO but also shows significance compared with the uninjected control group. Rescue means the mean value of the group is close to the uninjected control and the statistical difference shows no significance compared with uninjected control group. J. Quantification of heart edema. Animal’s phenotypes were quantified as shown in the image and the percentage of total animals was calculated. In (B and E), one-way ANOVA with Tukey’s multiple comparison correction is shown: ns, not significant P ≥ .05, ∗P < .05, ∗∗P < .01, ∗∗∗P < .001 and ∗∗∗∗P < .0001 compared with tars2 MO group. |