
- Title
-
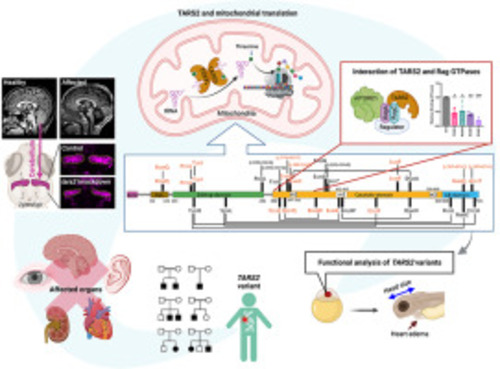
Clinical, neuroradiological and molecular characterization of mitochondrial threonyl-tRNA-synthetase (TARS2)-related disorder
- Authors
- Accogli, A., Lin, S.J., Severino, M., Kim, S.H., Huang, K., Rocca, C., Landsverk, M., Zaki, M., Al-Maawali, A., Srinivasan, V.M., Al-Thihli, K., Schaefer, G.B., Davis, M., Tonduti, D., Doneda, C., Marten, L.M., Mühlhausen, C., Gomez, M., Lamantea, E., Mena, R., Nizon, M., Procaccio, V., Begtrup, A., Telegrafi, A., Cui, H., Schulz, H.L., Mohr, J., Biskup, S., Loos, M.A., Aráoz, H.V., Salpietro, V., Keppen, L.D., Chitre, M., Petree, C., Raymond, L., Vogt, J., Swayer, L.B., Basinger, A.A., Pedersen, S.V., Pearson, T.S., Grange, D.K., Lingapp, L., McDunnah, P., Horvath, R., Cogne, B., Isidor, B., Hahn, A., Gripp, K., Jafarnejad, S.M., Ostergaard, E., Prada, C.E., Ghezzi, D., Gowda, V.K., Taylor, R.W., Sonenberg, N., Houlden, H., Sissler, M., Varshney, G.K., Maroofian, R.
- Source
- Full text @ Genet. Med.
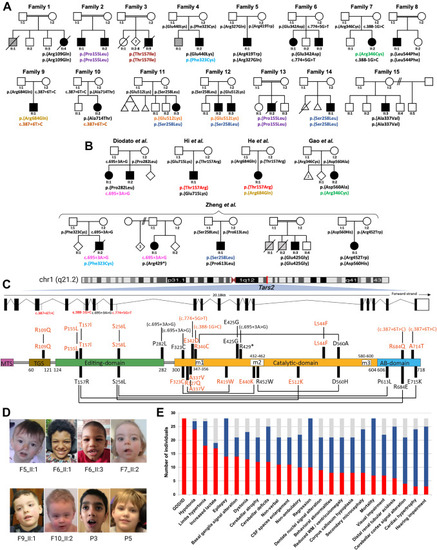
Clinical summary of individuals with biallelic TARS2 variants. Pedigree of families 1-15 (A) and previously reported individuals (B). Genotypes of tested individuals are indicated under the symbols. Variants observed in more than 1 family have been shown in different colors. In the pedigree, squares represent males, circles represent females, black shaded symbols denote affected individuals harboring biallelic TARS2 variants, and the gray shaded symbol refer to individuals presumably affected by the same disorder yet not tested. C. Schematic depiction of TARS2 transcript (ENSG00000143374) and the modular human mitochondrial threonyl-tRNA synthetase (TARS2) protein (ENSP00000358060) with localization of the disease associated variants. The different functional domains are shown to scale, named, and colored. MTS and AB stand for mitochondrial targeting sequence and anticodon-binding, respectively. m1, m2, and m3 are catalytic motifs 1, 2, and 3, respectively. Missense variants are indicated in red for those reported in the present study and in black for those reported elsewhere. Allelic compositions, as identified in individuals, are linked through black lines. Variants that do not lead to missense variants are indicated in brackets (because they correspond to genomic modifications). Although amino acid conversion of a given mutation is generally preceded by the letter “p.,” this is omitted for sake of simplicity. D. Clinical features of individuals with biallelic TARS2 variants. Subtle and non-specific dysmorphic features are indicated, such as thin upper lip vermilion in individual II:1 of family 5; mild coarse facial features in individuals II:1 and II:3 of family 6; short nose, long philtrum, and thin upper lip vermilion in individual II:2 of family 7; left eye strabismus and right uplifted earlobe in individual II:1 of family 9; broad and prominent forehead, sparse eyebrows, infraorbital creases, thin upper lip vermilion, and dimple chin in patient II:2 of family 10; thick eyebrows in individual 3; and deep set eyes in individual 5 previously reported by Zheng et al.11,12 E. Phenotypic bar graph showing the most relevant clinical and radiological features among all individuals so far identified with biallelic TARS2 variants. Red: number of individuals out of 28 showing each feature. Blue: number of individuals without each specific feature. Gray: number of individuals for whom a specific feature or the brain MRI was not available. |
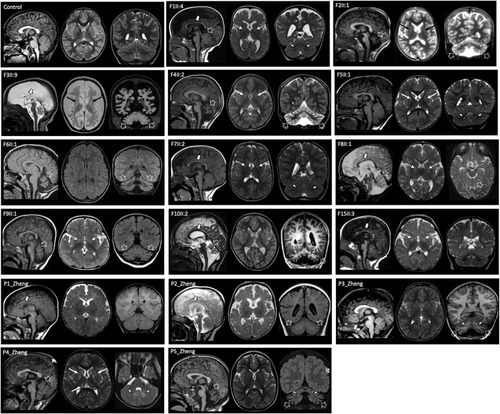
Neuroradiological features of individuals with biallelic TARS2 variants and of a control subject for comparison. Most of the individuals present cerebellar atrophy (open arrows) variably associated with cerebellar cortex signal alterations and dentate nuclei T2/FLAIR hyperintensity (arrowheads). There is mild-to moderate white matter volume loss and/or enlargement of the cerebral CSF spaces in most individuals. The corpus callosum is thin in 8 individuals (thick arrows). Note the faint T2 signal abnormalities in the globi pallidi (dashed arrows) and putamen/caudate nuclei (thin arrows). CSF, cerebrospinal fluid. |
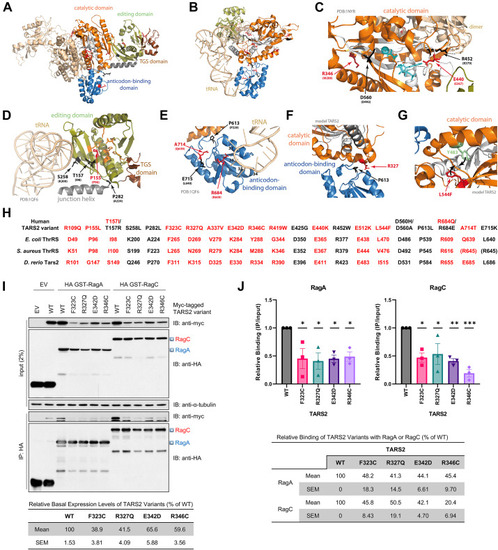
Protein modeling and interaction of mutant TARS2 with Rag GTPase. A. Structure of the dimeric ThrRS from Staphylococcus aureus (PDB: 1NYR;14). Functional domains are named and colored in 1 monomer. B. Structure of one monomer of the Escherichia coli ThrRS, in complex with cognate tRNA with the CCA extremity of the tRNA pointing into the catalytic core (PDB: 1QF6;15). C-G. Structural environment of the wild-type residues and theoretical impact of their variants. Structural templates are indicated in light gray. The 3D model of human TARS2 is from misynpat.org.16,18 In all models, motifs 1, 2, and 3 that build the catalytic core are colored in white. Residues found mutated are shown in stick representation and colored in red for those reported in the present study and in black for those reported elsewhere (see Figure 1 and Supplemental Table 2 for references), with the corresponding amino acid from either S. aureus or E. coli indicated in brackets. C. Zoom into the catalytic core where catalytic Zn2+ and small substrates (aminoacyl-adenylate aa∼AMP and PPi) are shown in cyan. D. Zoom into the editing domain. Catalytic residues for editing, as identified in,21 are shown in orange. E. Zoom into the anticodon-binding domain. Key nucleotides from the tRNA anticodon loop are numbered (34-37). F. Zoom into the interface between the catalytic domain and the anticodon-binding domain. G. Example of possible local distortion engendered by the L544F variant. All molecular representations were prepared with PyMOL (Schrödinger, Inc.). H. Correspondence of residues of human (Uniprot: Q9BW92), E. coli (Uniprot: P0A8M3), S. aureus (Uniprot: Q2YTA7), and D. rerio (NCBI: XP_021322466.1) in the 3 structural templates as established using the multiple sequence alignment. I. Co-immunoprecipitation (co-IP) interaction of mutant TARS2 variants with Rag GTPases. HEK293T cells were transfected with the indicated plasmids. Co-IP was performed using an anti-hemagglutinin (HA) antibody. Triangles on the right indicate the full-length RagA (blue) and RagC (red). α-tubulin is shown as a loading control. EV, empty vector; WT, wildtype. J. Mean ± SEM of relative binding of TARS2 with RagA (left) or RagC (right) from 3 independent co-IP experiments is shown. ∗P < .05; ∗∗P < .01; ∗∗∗P < .001 (one-way ANOVA followed by Dunnett’s post hoc test). |
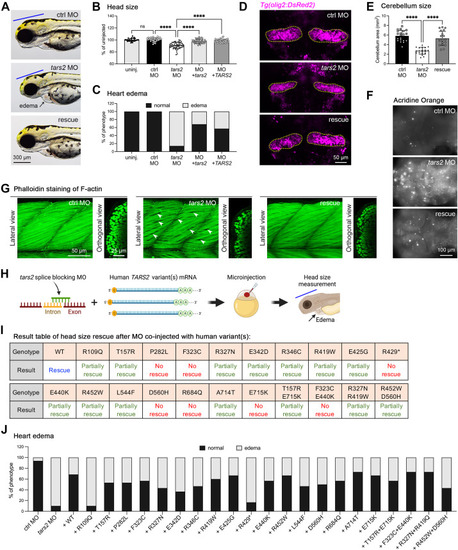
Functional testing of TARS2 variants in zebrafish. A. Representative images of an embryo injected with control MO (ctrl MO), tars2 MO, or tars2 MO rescue at 3 dpf. Lateral view, anterior to the left. The blue line indicates brain size, and the black arrow indicates heart edema. B. Quantification of head size from uninjected (n = 30 animals), ctrl MO (n = 31 animals), tars2 MO (n = 52 animals), tars2 MO + zebrafish tars2 RNA (+ tars2) (n = 41 animals), and tars2 MO + human TARS2 RNA (+ TARS2) (n = 52 animals) embryos at 3 dpf. Each symbol represents 1 animal. Values were calculated as percentage of the mean value of uninjected embryos. Error bars = mean ± SD. C. Quantification of heart edema. Animals were collected according to phenotype as shown in the image and calculated as the percentage of total animals. D. Representative cerebellum image of Tg(olig2:DsRed) of ctrl MO, tars2 MO, and tars2 MO rescue at 3 dpf. The red fluorescence color was replaced with pseudo-magenta color. E. Quantification of cerebellum area as indicated in (D). n = 10 animals. Error bars = mean ± SD. F. Acridine orange was used to stain brain in ctrl MO, tars2 MO, and tars2 MO rescue at 3 dpf. Scale bar = 100 μm. G. Confocal projections of phalloidin stained muscle fibers in the trunk region of ctrl MO, tars2 MO, and tars2 MO rescue. The anterior is shown to the left and dorsal at the top. The right panels show orthogonal views, dorsal to the top. H. Experimental approach for functionally characterizing human TARS2 variants. In vitro synthetic human TARS2 variant mRNA was mixed with zebrafish tars2 splice-blocking MO and microinjected into 1-cell stage embryos, followed by phenotypic evaluation at 3 dpf. The blue line indicates head size and the black arrow indicates heart edema. I. Summary of rescue results with the mean value for each group (from Figure S6). No rescue means the mean value of the group is close to the mean of tars2 MO group, and the statistic shows no significance compared with tars2 MO group. Partially rescued means the mean value of the group is higher than the mean of tars2 MO group but lower than the mean of uninjected control group, and the statistical difference shows significance compared with tars2 MO but also shows significance compared with the uninjected control group. Rescue means the mean value of the group is close to the uninjected control and the statistical difference shows no significance compared with uninjected control group. J. Quantification of heart edema. Animal’s phenotypes were quantified as shown in the image and the percentage of total animals was calculated. In (B and E), one-way ANOVA with Tukey’s multiple comparison correction is shown: ns, not significant P ≥ .05, ∗P < .05, ∗∗P < .01, ∗∗∗P < .001 and ∗∗∗∗P < .0001 compared with tars2 MO group. |
|