
Fig. 3
- ID
- ZDB-FIG-240206-23
- Publication
- Accogli et al., 2023 - Clinical, neuroradiological and molecular characterization of mitochondrial threonyl-tRNA-synthetase (TARS2)-related disorder
- Other Figures
- All Figure Page
- Back to All Figure Page
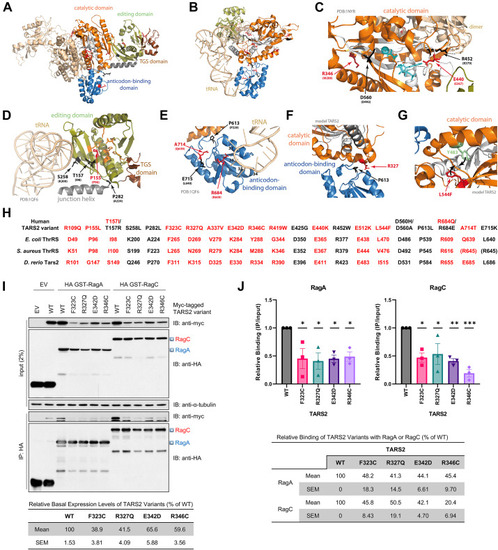
Protein modeling and interaction of mutant TARS2 with Rag GTPase. A. Structure of the dimeric ThrRS from Staphylococcus aureus (PDB: 1NYR;14). Functional domains are named and colored in 1 monomer. B. Structure of one monomer of the Escherichia coli ThrRS, in complex with cognate tRNA with the CCA extremity of the tRNA pointing into the catalytic core (PDB: 1QF6;15). C-G. Structural environment of the wild-type residues and theoretical impact of their variants. Structural templates are indicated in light gray. The 3D model of human TARS2 is from misynpat.org.16,18 In all models, motifs 1, 2, and 3 that build the catalytic core are colored in white. Residues found mutated are shown in stick representation and colored in red for those reported in the present study and in black for those reported elsewhere (see Figure 1 and Supplemental Table 2 for references), with the corresponding amino acid from either S. aureus or E. coli indicated in brackets. C. Zoom into the catalytic core where catalytic Zn2+ and small substrates (aminoacyl-adenylate aa∼AMP and PPi) are shown in cyan. D. Zoom into the editing domain. Catalytic residues for editing, as identified in,21 are shown in orange. E. Zoom into the anticodon-binding domain. Key nucleotides from the tRNA anticodon loop are numbered (34-37). F. Zoom into the interface between the catalytic domain and the anticodon-binding domain. G. Example of possible local distortion engendered by the L544F variant. All molecular representations were prepared with PyMOL (Schrödinger, Inc.). H. Correspondence of residues of human (Uniprot: Q9BW92), E. coli (Uniprot: P0A8M3), S. aureus (Uniprot: Q2YTA7), and D. rerio (NCBI: XP_021322466.1) in the 3 structural templates as established using the multiple sequence alignment. I. Co-immunoprecipitation (co-IP) interaction of mutant TARS2 variants with Rag GTPases. HEK293T cells were transfected with the indicated plasmids. Co-IP was performed using an anti-hemagglutinin (HA) antibody. Triangles on the right indicate the full-length RagA (blue) and RagC (red). α-tubulin is shown as a loading control. EV, empty vector; WT, wildtype. J. Mean ± SEM of relative binding of TARS2 with RagA (left) or RagC (right) from 3 independent co-IP experiments is shown. ∗P < .05; ∗∗P < .01; ∗∗∗P < .001 (one-way ANOVA followed by Dunnett’s post hoc test). |