
Figure 2
- ID
- ZDB-FIG-240113-38
- Publication
- Uribe-Arias et al., 2023 - Radial astrocyte synchronization modulates the visual system during behavioral-state transitions
- Other Figures
- All Figure Page
- Back to All Figure Page
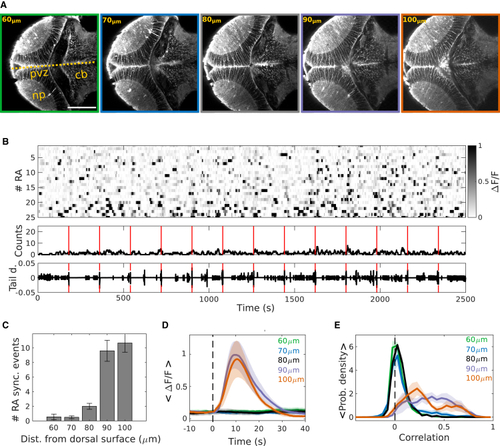
Tectal RA synchronization is specific to the ventral region of the optic tectum (A) A series of optical sections of the optic tectum showing the morphology of RAs expressing GCaMP, imaged at different depths using two-photon microscopy. Zero μm: dorsal skin. Yellow dashed line, the midline; cb, cerebellum; np, neuropil; pvz, periventricular zone. Scale bars: 100 μm. (B) Top: representative raster plot of RA activity in a dorsal region of the optic tectum (60 μm). Gray scale bar: ΔF/F. Middle: number of active RAs. Bottom: tail deflection (L0/R). Red line: time of mild electric stimuli. (C) Mean of the number of RA synchronous Ca2+ events per hour at five different depths of the OT (mean: 60 μm, 0.56 ± 0.38; 70 μm, 0.50 ± 0.19; 80 μm, 2.00 ± 0.41; 90 μm, 9.60 ± 1.43; 100 μm, 10.67 ± 1.71; p = 5.85 × 10⁻⁵, Kruskal-Wallis test and multiple comparison test). (D) Mean amplitude of the ΔF/F of RAs following a mild electric stimulus, at different tectal depths. Note that at depths of 90 and 100 μm, the amplitude of the synchronous Ca2+ events was significantly higher than for the dorsal tectal regions (mean: 60 μm, 0.15 ± 0.03; 70 μm, 0.12 ± 0.02; 80 μm, 0.13 ± 0.04; 90 μm, 1.02 ± 0.21; 100 μm, 0.94 ± 0.28; p = 7.8 × 10⁻⁴, ΔF/F; Kruskal-Wallis test and multiple comparison test). (E) The probability density of the pairwise correlations between the activity of the RAs, at the different imaged depths of the optic tectum. The medians of the distributions for the depths of 90 and 100 μm were significantly higher than the rest (median: 60 μm, 0.03 ± 0.01; 70 μm, 0.04 ± 0.04; 80 μm, 0.06 ± 0.01; 90 μm, 0.37 ± 0.07; 100 μm, 0.30 ± 0.05; p = 4.69 × 10⁻⁶; Kruskal-Wallis test and multiple comparison test). 60 μm: green, n = 9 larvae; 70 μm: blue, n = 8 larvae; 80 μm: black, n = 4 larvae; 90 μm, magenta: n = 5 larvae; 100 μm: orange, n = 6 larvae. |