
- Title
-
Radial astrocyte synchronization modulates the visual system during behavioral-state transitions
- Authors
- Uribe-Arias, A., Rozenblat, R., Vinepinsky, E., Marachlian, E., Kulkarni, A., Zada, D., Privat, M., Topsakalian, D., Charpy, S., Candat, V., Nourin, S., Appelbaum, L., Sumbre, G.
- Source
- Full text @ Neuron
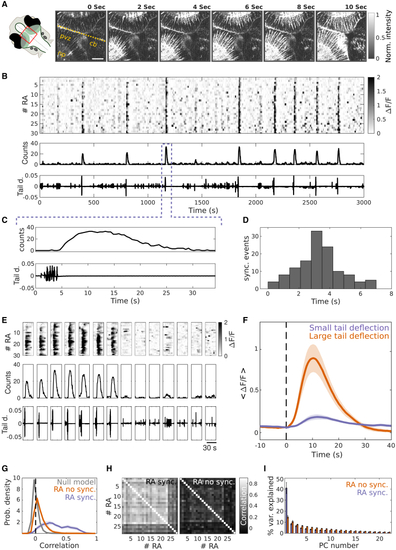
Tectal RAs synchronize their Ca2+ transients following an escape behavior (A) Left: scheme of the zebrafish head showing the imaged area (red square). Shaded green: optic tectum. Right: a temporal series of an optical section of the optic tectum of a zebrafish larva expressing GCaMP in RAs, imaged using a two-photon microscope (red square on the left). Note the changes in fluorescence of the RAs. Time zero indicates the onset of an escape behavior. Yellow dashed line, brain’s midline; cb, cerebellum; np, neuropil; pvz, periventricular zone. Gray scale bar: normalized florescence. Scale bars: 80 μm. (B) Top: raster plot of RAs’ spontaneous activity. Gray scale bar: ΔF/F. Middle: number of active RAs. Bottom: tail deflection (L0/R). Note the synchronous spontaneous Ca2+ events across all RAs. L0, length of the fish at rest; R, distance to the center of the tail curvature. (C) Zoom of the area in (B), indicated by the magenta dashed lines. (D) Histogram of the delay between the onset of the spontaneous escape behaviors and the onset of RA synchronous Ca2+ events (mean: 3.13 ± 0.6 s). (E) Top: raster plots of RA activity around 14 representative spontaneous tail movements. Gray scale bar: ΔF/F. Middle: number of active RAs. Bottom: tail deflection (L0/R). The first seven sub-panels show escape behaviors; the seven last sub-panels display low-deflection swimming bouts. (F) Mean amplitude of RA Ca2+ transients following a spontaneous tail movement (dashed line, time zero) for large-deflection (orange) and low-deflection (magenta) tail movements (large deflection, 0.98 ± 0.16; low-deflection, 0.24 ± 0.03 ΔF/F, p = 2.2 × 10⁻⁴; two-sided rank-sum test; n = 11 larvae). (G) Average probability density distribution of RA pairwise correlations (magenta), pairwise correlation of RAs without taking into account the synchronous events (orange), and the corresponding null model (gray) (mean correlations, RAs: 0.38 ± 0.04; RAs without synchronous events: 0.07 ± 0.01; null model: 4.3 × 10⁻⁴ ± 7.8 × 10⁻⁴; p = > 0.001, ANOVA and multiple comparison test; n = 11). (H) Left: example of a pairwise-correlation matrix between the Ca2+ transients of RAs. Note that RAs form a single main cluster. Right: example of a pairwise-correlation matrix between the Ca2+ transients of RAs without synchronous events, color scale bar: correlation value. (I) The eigenvector values of the different principal components (PCs), RA with synchronous events (magenta), RA without synchronous events (orange). Note that most of the variance can be explained by a single component only when RA synchronizations are taken into account, suggesting that the synchronous events involve all RAs (RA synch, PC1: 41.08% ± 4.97%; RA spont, PC1: 14.78% ± 1.27%). See also |
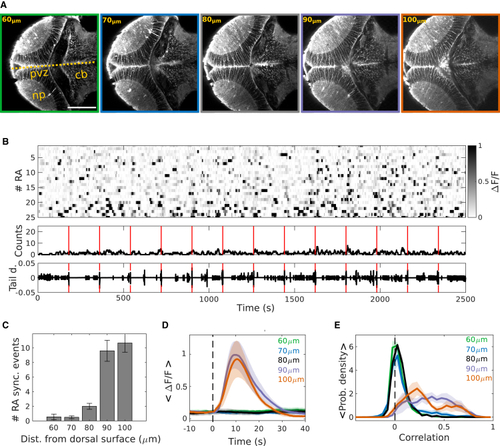
Tectal RA synchronization is specific to the ventral region of the optic tectum (A) A series of optical sections of the optic tectum showing the morphology of RAs expressing GCaMP, imaged at different depths using two-photon microscopy. Zero μm: dorsal skin. Yellow dashed line, the midline; cb, cerebellum; np, neuropil; pvz, periventricular zone. Scale bars: 100 μm. (B) Top: representative raster plot of RA activity in a dorsal region of the optic tectum (60 μm). Gray scale bar: ΔF/F. Middle: number of active RAs. Bottom: tail deflection (L0/R). Red line: time of mild electric stimuli. (C) Mean of the number of RA synchronous Ca2+ events per hour at five different depths of the OT (mean: 60 μm, 0.56 ± 0.38; 70 μm, 0.50 ± 0.19; 80 μm, 2.00 ± 0.41; 90 μm, 9.60 ± 1.43; 100 μm, 10.67 ± 1.71; p = 5.85 × 10⁻⁵, Kruskal-Wallis test and multiple comparison test). (D) Mean amplitude of the ΔF/F of RAs following a mild electric stimulus, at different tectal depths. Note that at depths of 90 and 100 μm, the amplitude of the synchronous Ca2+ events was significantly higher than for the dorsal tectal regions (mean: 60 μm, 0.15 ± 0.03; 70 μm, 0.12 ± 0.02; 80 μm, 0.13 ± 0.04; 90 μm, 1.02 ± 0.21; 100 μm, 0.94 ± 0.28; p = 7.8 × 10⁻⁴, ΔF/F; Kruskal-Wallis test and multiple comparison test). (E) The probability density of the pairwise correlations between the activity of the RAs, at the different imaged depths of the optic tectum. The medians of the distributions for the depths of 90 and 100 μm were significantly higher than the rest (median: 60 μm, 0.03 ± 0.01; 70 μm, 0.04 ± 0.04; 80 μm, 0.06 ± 0.01; 90 μm, 0.37 ± 0.07; 100 μm, 0.30 ± 0.05; p = 4.69 × 10⁻⁶; Kruskal-Wallis test and multiple comparison test). 60 μm: green, n = 9 larvae; 70 μm: blue, n = 8 larvae; 80 μm: black, n = 4 larvae; 90 μm, magenta: n = 5 larvae; 100 μm: orange, n = 6 larvae. |

Muscle proprioception does not play a role in RAs Ca2+ synchronization (A) Top: raster plot of RA spontaneous Ca2+ activity of paralyzed larvae. Middle: number of Ca2+ events across RAs. Bottom: tail deflection (L0/R). Gray scale bar: ΔF/F. (B) As in (A), but mild electric stimuli were presented every 180 s to induce escape behaviors. Red line: time of the mild electric stimulus. (C) The mean Ca2+ activity of RAs associated with mild electric stimuli (time zero) in paralyzed (magenta) and non-paralyzed (orange) larvae. Mean amplitude of the two distributions were not significantly different (non-paralyzed, 0.98 ± 0.16; paralyzed, 0.83 ± 0.15, ΔF/F; p = 0.85; two-sided rank-sum test, n = 11 control, n = 5 paralyzed). |

RAs sense an increase in norepinephrine during synchronous Ca2+ events (A) Scheme of the zebrafish head showing the imaged areas. Top: lateral view, OT dorsal region (green), OT ventral region (orange). Bottom: dorsal view, imaged area (red square). Shaded green: OT. np, tectal neuropil; pvz, periventricular zone; cb, cerebellum; dashed line, midline. (B) Optical section of the OT, in a larva expressing the NE sensor (GRABNE1m) under an RA promoter (her4.1). Green: left, OT dorsal layers; right, zoom of the dashed square area. Orange: left, OT ventral layers; right, zoom of the dashed square area. (C) Temporal series of an optical section of the OT of a zebrafish larva expressing GRABNE1m in RAs, imaged using a two-photon microscope (orange dashed square in [B]). Note the changes in fluorescence of the RAs. Time zero indicates a mild electric stimulation to induce an escape behavior. Gray scale bar: normalized florescence. (D) Top: raster plot of RAs’ NE activity in the ventral OT. Bottom: mean NE activity across RAs. Gray scale bar: ΔF/F. Red line: time of the mild electric stimulation. (E) The mean NE activity of RAs in the ventral OT. Dashed line: mild electric stimulus. (F and G) As in (D) and (E), for the dorsal OT. The mean amplitude of the NE transients in the ventral OT was significantly larger than those in the dorsal OT (mean amplitude: dorsal OT, 0.03 ± 0.004; ventral OT, 0.11 ± 0.01; p > 0.001; two-sided rank-sum test, n = 7 dorsal OT, n = 11 ventral OT). Scale bars: 50 μm. See also |
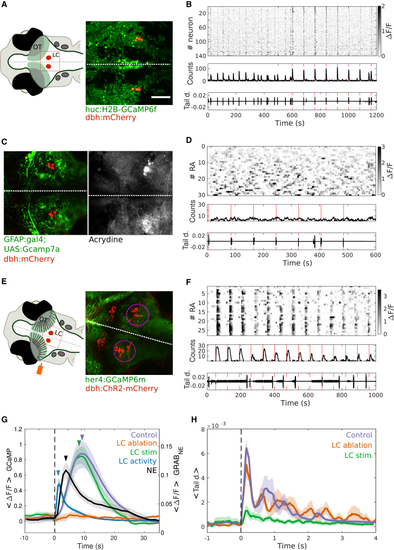
The tectal RAs’ synchronization is mediated by the locus coeruleus (A) Left: scheme of the head of a zebrafish larva. Red circles: locus coeruleus (LC), shaded green: optic tectum. Red square: area imaged on the right. Right: optical section containing the LC (red neurons). Green: neurons expressing GCaMP. Red: neurons expressing mCherry under an LC-specific promoter (dbh). White dashed line: brain’s midline. Scale bars: 80 μm. (B) Top: raster plot of the LC activity during periods of spontaneous activity and mild electric stimuli. Gray scale bar: ΔF/F. Middle: number of active LC neurons. Bottom: tail deflection (L0/R). Red line: time of mild electric stimuli. (C) Left: optical section containing the LC (neurons in red) before laser ablation. Green: RAs expressing GCaMP7. Red: neurons expressing mCherry under an LC-specific promoter (dbh). Right: staining of the same optical section after ablation with acridine orange to label apoptotic cells. Dashed line: brain’s midline. (D) Top: raster plot of the activity of RAs in the optic tectum following LC ablation, while presenting mild electric stimuli. Gray scale bar: ΔF/F. Middle: number of active LC neurons. Bottom: tail deflection (L0/R). Red line: time of mild electric stimuli. Note the absence of RA synchronization. (E) Left: scheme of the head of the zebrafish larva. Red circles: LC, shaded green: optic tectum. Red square: area imaged on the right. Blue: position of the beam of light used for optogenetic stimulation (100 μm fiber optic). Right: optical section containing the LC neurons expressing ChR-2 (red). Green: RAs expressing GCaMP. Red: neurons expressing ChR2-mCherry under an LC promoter (dbh). White dashed line: brain’s midline. Magenta dashed circle: LC area. (F) Top: raster plot of the activity of RAs in the optic tectum following LC optogenetic stimulation. Gray scalebar: ΔF/F. Middle: number of active RAs. Bottom: tail deflection (L0/R). Red line: time of LC optogenetic stimulation. Note the RA synchronization following LC stimulation, and its absence of correlation with tail movements. (G) The mean ΔF/F of the Ca2+ transients of the RAs following an escape behavior (control, magenta, n = 10), after ablation of the LC (LC ablation, orange, n = 4), and after optogenetic stimulation of LC (LC stimulus, green, n = 7). Note that the gap in the green line represents the saturation of the photomultiplier tube (PMT) during the optogenetic stimulation. The mean ΔF/F of the Ca2+ transients in LC neurons following an escape behavior (LC activity, blue). The mean NE transients sensed by the RAs following a mild electric stimulus (NE, black). Note that the mean amplitude of ΔF/F of RAs in control and LC stimulation conditions were not significantly different. However, these were significantly different from LC ablation (control, 0.89 ± 0.17; LC stimulation, 0.88 ± 0.11; LC ablation, 0.12 ± 0.03, ΔF/F; p = 8.7 × 10⁻³; Kruskal-Wallis test and multiple comparison test). The colored arrowheads depict the peaks of the different curves. Note that LC neurons show the earliest transients, followed by the NE transients sensed by the RAs in the OT. The latest transients are those of the RAs during their synchronization events (LC neurons, 2.61 ± 0.50 s; NE in RA, 6.20 ± 0.44 s; RAs after LC optogenetic stimulation, 9.61 RAs ± 0.30 s; RAs after escape behavior, 10.70 ± 0.71 s; p < 0.001; Kruskal-Wallis test and multiple comparison test). (H) Mean absolute tail deflection aligned to the onset of the spontaneous tail movements (black dashed line). Magenta: control conditions; orange: after LC ablation; green: LC optogenetic stimulation. Note that the integral of the tail deflection was not significantly different between control and LC ablation conditions, but these were significantly different from the direct optogenetic stimulation of LC (control: 0.36 ± 0.05; LC ablation: 0.39 ± 0.09; LC stimulation: 0.08 ± 0.05 L0.s/R; p = 0.01; Kruskal-Wallis test and multiple comparison test). Scale bars: 80 μm. Dashed line: onset of induced escape behavior. See also |
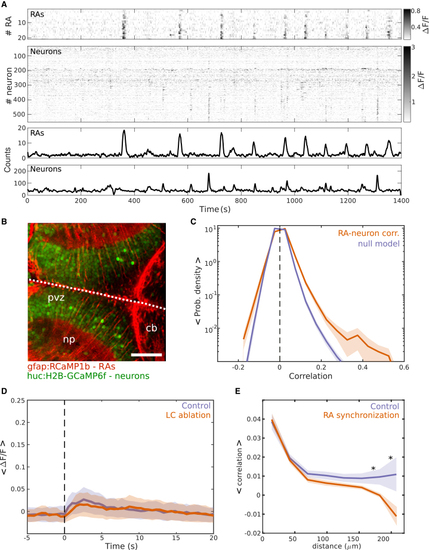
RA synchronous events modulate the functional correlations between tectal neurons (A) First: raster plot of the RAs’ spontaneous activity. Second: raster plot of the tectal neurons’ spontaneous activity; gray scale bar: ΔF/F. Third: number of active RAs. Fourth: number of active neurons. (B) Optical section of the optic tectum of a zebrafish larva expressing GCaMP under a neuronal promoter (HuC:GCaMP6f, green) and RCaMP1b under the control of a glial promoter (gfap:RCaMP, red). White dashed line: brain’s midline. cb, cerebellum; np, neuropil; prv, periventricular zone. Scale bars: 80 μm. (C) Probability density distribution of the mean pairwise correlations between RAs and neurons in the optic tectum (orange) and its respective null model (magenta), (RAs-neurons: 0.01 ± 4 × 10⁻³; null model, 4 × 10⁻³ ± 3 × 10⁻³, p = 0.053; two-sided rank-sum test, n = 7 larvae. (D) Mean ΔF/F of tectal neurons following an escape behavior (time zero). Orange: following LC ablation. Magenta: control conditions. Mean amplitude of two distributions were not significantly different (control: 0.079 ± 0.03; LC ablation: 0.070 ± 0.02 ΔF/F; p = 0.77, two-sided rank-sum test, n = 4 larvae). (E) The relationship between the mean pairwise correlations between the spontaneous activity of tectal neurons and their physical distance (magenta, control) and during induced RA synchronization. Note that RA synchronization is associated with a decrease in the pairwise correlations between distant neurons (182 μm, spontaneous activity: 6.8 × 10⁻³ ± 4.10 × 10⁻³; RA synchronization: 0.9 × 10⁻³ ± 1.2 × 10⁻³; p = 0.03. 208 μm, spontaneous activity: 1.8 × 10⁻³ ± 9 × 10⁻³ ± 8.7 × 10⁻³. RA synchronization: −6.6 × 10⁻³ ± 4.9 × 10⁻³; p = 0.049, two-sided rank-sum test, n = 7 larvae, Kolmogorov-Smirnov test was applied to evaluate if the distributions are different, p = 0.0054). Scale bars: 50 μm. See also |
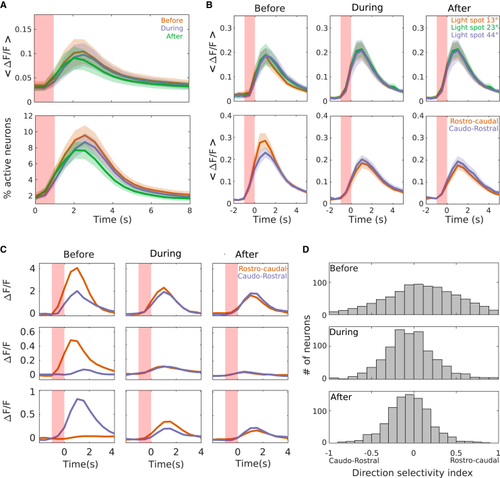
RA synchronization modulates the directional selectivity of tectal neurons (A) Top: mean ΔF/F of tectal neuron responses to visual stimulation before (orange), during (magenta), and after (green) RA synchronization events. Bottom: as on top but for the percentage of responsive neurons. Shaded red area: time of the visual stimulus. The three curves do not show any significant difference (top: before, 0.89 ± 0.27; during, 0.82 ± 0.23; after, 0.78 ± 0.24 ΔF/F.s; p = 0.46, Kruskal-Wallis test and multiple comparison test. Bottom: before, 9.12 ± 1.32; during, 8.23 ± 0.984; after, 7.33 ± 1.06 ΔF/F.s; p = 0.39, Kruskal-Wallis test and multiple comparison test). (B) Top: mean ΔF/F of tectal neuron responses to visual stimuli consisting of light spots of 13° (orange), 23° (green), and 44° (magenta) (light spots of 13°; before: 0.67 ± 0.14; during: 0.81 ± 0.16; after: 0.78 ± 0.17 ΔF/F.s; p = 0.70. Light spots of 23°; before: 0.65 ± 0.18; during: 0.81 ± 0.13; after: 0.69 ± 0.13 ΔF/F.s; p = 0.43. Light spots of 44°; before: 0.64 ± 0.16; during: 0.77 ± 0.16; after: 0.67 ± 0.16 ΔF/F.s; p = 0.85. Kruskal-Wallis test and multiple comparison test). Bottom: as on top for light bars moving in a rostro-caudal (orange) or caudo-rostral (magenta) direction (rostro-caudal: before, 1.54 ± 0.42; during, 0.99 ± 0.32; after, 0.90 ± 0.25 ΔF/F.s; p = 0.03. Caudo-rostral, before, 1.47 ± 0.35; during, 1.10 ± 0.25; after, 0.94 ± 0.29 ΔF/F.s; p = 0.13, Kruskal-Wallis test and multiple comparison test). (C) Three examples of the ΔF/F of individual neuron responses to light bars moving in the rostro-caudal (orange) and the caudo-rostral (magenta) direction, during and after the induction of RA synchronization. Note the reduction of the response to a specific direction during and right after the RA synchronization event. (D) Distributions of the direction selectivity of tectal neurons before (top), during (middle), and after (bottom) the induction of RA synchronization events. Note that high direction-selective values are reduced during and right after RA synchronizations (Kolmogorov-Smirnov test; before-during: p = 6.8 × 10⁻³; before-after: p = 3.6 × 10⁻³; during-after: p = 0.98; before, −10 s, during, 10.5 s, and after, 20 s, the RA synchronous event). See also |
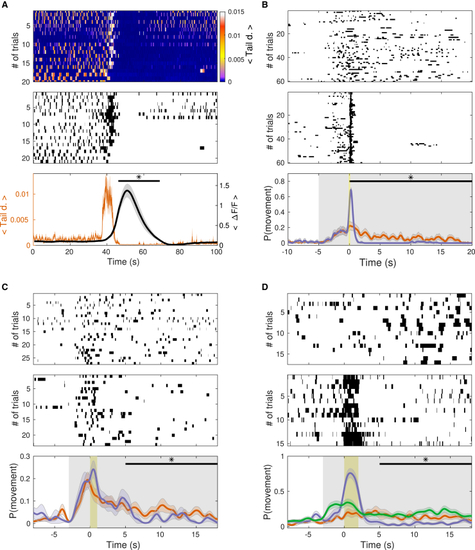
RA synchronization is associated with a decrease in spontaneous and visually induced motor behaviors (A)Top: a representative raster plot of tail deflection showing spontaneous tail movements. Color scale bar: tail deflection. Middle: a representative binary raster plot of the tails bouts on top. Bottom: orange, the averaged tail deflection across trials of spontaneous tail movements, aligned according to the maximal amplitude of RA synchronous Ca2+ events. Black, mean amplitude of the ΔF/F of RAs following an escape behavior. Note that the averaged tail deflection during the RA synchronous Ca2+ events was significantly smaller following the escape behaviors than before the escape behavior (mean tail deflection; during RA synchronization: 30-s period 0.19 × 10⁻³ ± 0.04 × 10⁻³. Before RA synchronization: 10-s period, 1.2 × 10⁻³ ± 0.58 × 10⁻³ [L0/R], p = 0.009, two-sided rank-sum test, n = 6 larvae). (B) Tail movements during the induction of RA synchronizations via a mild electric stimulus, while the larvae were engaged in OMR. Top: binary raster plot of tail bouts during control trials (no RA synchronization). Middle: raster plot of tail bouts in which a mild electric stimulus was presented. Bottom: the averaged probability of tail movements across trials without mild electric stimulus (top raster, orange) and with mild electric stimulation (middle raster, magenta). Shaded gray area: OMR, shaded yellow area: mild electric stimulus. Note that the probability of a tail bout after the mild stimulus was significantly lower than in control trials (20-s window starting 1 s after the mild electric stimulus, P[movement|mild electric stimulus] = 0.004 ± 0.014, P[movement|control] = 0.06 ± 0.05, p = 0.001, two-sided rank-sum test, n = 6 larvae). (C) As in (B), but RA synchronization was induced using optogenetic stimulation of LC (shaded yellow area). Note that the probability of a tail bout 5 s after the LC activation was significantly lower than that of control trials (10-s window starting 5 s after the LC activation, P[movement|LC activation] = 0.028 ± 0.022, P[movement|control] = 0.062 ± 0.032, p = 0.014, two-sided rank-sum test, n = 8 larvae). (D) As in (B), but RA synchronous Ca2+ events were induced by direct optogenetic stimulation of the RAs. Green curve: the averaged probability for wild-type larvae (not expressing ChR2, control). The probability of a tail bout 5 s after the RA activation was significantly lower than that of control trials (10-s window starting 5 s after the RA activation, P[movement|optogenetic stimulus] = 0.063 ± 0.07, P[movement|control] = 0.15 ± 0.07, p = 0.002, two-sided rank-sum test, n = 5 larvae. The optogenetic stimulation did not affect the behavior of wild-type larvae, P[movement|optogenetic stimulus] = 0.12 ± 0.1, P[movement|optogenetic control] = 0.16 ± 0.14, p = 0.36, two-sided rank-sum test, n = 8 larvae). |