
Fig. 8
- ID
- ZDB-FIG-231227-37
- Publication
- Greysson-Wong et al., 2023 - rasa1-related arteriovenous malformation is driven by aberrant venous signalling
- Other Figures
- All Figure Page
- Back to All Figure Page
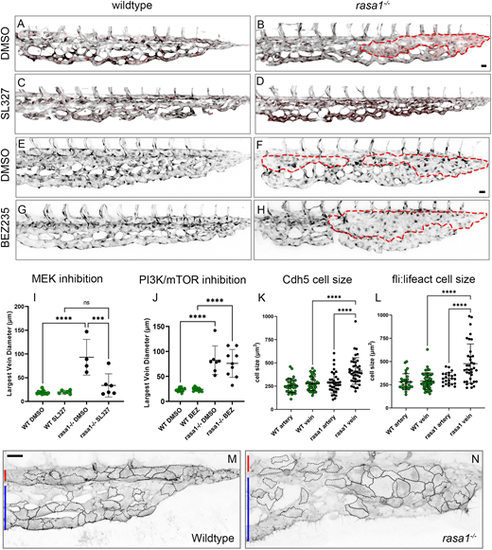
Pharmacological rescue of rasa1 mutants by MEK inhibition and venous cell size changes. (A-D) Confocal images of wild type and rasa1 mutants on Tg(kdrl:EGFP;gata1a:dsRed) [Tg(kdrl:EGFP) is in black] when treated with DMSO or the MEK inhibitor SL327. Vascular malformations are outlined with a dashed red line. (E-H) Confocal images of wild type and rasa1−/− on Tg(kdrl:EGFP) (black) when treated with DMSO and BEZ235. (I) Rescue of largest vein diameter is seen in rasa1 mutants treated with SL327 (WTDMSO versus rasa1−/−DMSO, P<0.0001; WTSL327 versus rasa1−/−SL327, P=0.64; N=1 experiment). (J) No rescue is seen by the treatment of mutants with BEZ235. Quantification of the largest vein diameter in wild type and rasa1−/− treated with DMSO and BEZ235 [WTDMSO (n=19) versus rasa1−/−DMSO (n=7); P<0.0001; WTDMSO versus rasa1−/−BEZ235 (n=9), P<0.0001; N=5 experiments]. (K) Quantification of cell size at 48 hpf using the VE-Cadherin (Cdh5) membrane marker (WTartery, n=34; WTvein, n=38; rasa1−/−artery, n=36; rasa1−/−vein, n=41), where rasa1−/− vein cells are significantly larger than wild-type vein cells (P<0.0001) and larger than rasa1−/− arterial cells (P<0.0001). (L) Quantification of cell size at 48 hpf using the fli:lifeact marker (WTartery, n=29; WTvein, n=50; rasa1−/−artery, n=23; rasa1−/−vein, n=36) at 40×magnification also showing that rasa1−/− vein cells are significantly larger than wild-type vein cells (P<0.0001) and larger than rasa1−/− arterial cells (P<0.0001). (M,N) Confocal images of fli:lifeact transgene marking endothelial cells with schematic traces of cell borders in the DA (indicated by the adjacent red bar) and in the CVP (indicated by the adjacent blue bar) to show relative cell size in arteries and veins in wild types (M) and rasa1 mutants (N). Statistical analysis was carried out using one-way ANOVA with Sidak's correction. Data are mean±s.d. Scale bars: 20 µm. |