
Fig. 2
- ID
- ZDB-FIG-231227-31
- Publication
- Greysson-Wong et al., 2023 - rasa1-related arteriovenous malformation is driven by aberrant venous signalling
- Other Figures
- All Figure Page
- Back to All Figure Page
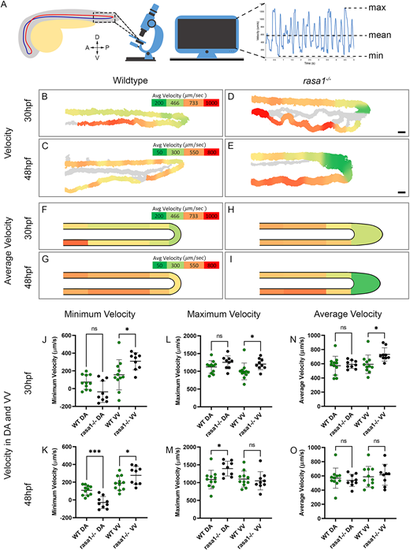
Blood flow velocity is affected by the vascular malformations in rasa1−/− embryos. (A) Diagram illustrating the areas where movies were captured and velocity metric calculation. (B-E) Velocity heatmaps of representative wild-type and rasa1 mutant embryos. (F-I) Mean velocity heatmaps of wild-type and rasa1 mutant embryos. (J-O) Quantification of minimum, maximum and mean velocities in wild types and rasa1 mutants at 30 hpf and 48 hpf (wild type 30 hpf and 48 hpf, n=11; rasa1−/− 30 hpf and 48 hpf, n=9). (J,K) Minimum velocity at 30 hpf and 48 hpf of wild type and rasa1 mutants in the DA and ventral vein (VV). (L,M) Maximum velocity at 30 hpf and 48 hpf of wild type and rasa1 mutants in the DA and VV. (N,O) Mean velocity at 30 hpf and 48 hpf of wild type and rasa1 mutants in the DA and VV. Statistical analysis was carried out using one-way ANOVA with Sidak's correction. Data are mean±s.d. Scale bars: 20 µm. |