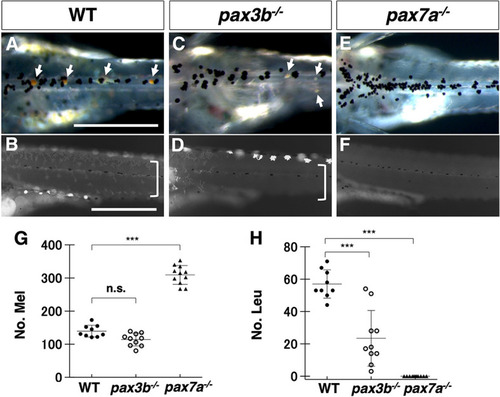
Phenotypes of medaka pax3 and pax7 mutants. (A-F) Medaka 9 dpf hatchlings. Comparison of pigment cell phenotypes between WT (A,B), pax3b−/− (C,D) and pax7a−/− (lf-2) (E,F). (A,C,E) Dorsal views of the trunk in dark field. (B,D,F) Lateral views of the trunk under UV light. Images are representative of more than ten embryos. Scale bars: 250 µm. (G,H) Quantification of the number of melanophores (G) and leucophores (H) on the dorsal surface of the trunk. Note that leucophores are not always white but often yellow or orange, and have strong fluorescence under UV light. See ‘Microscopy’ in the Materials and Methods section. The highly fluorescent cells in the ventral edge in B and in the dorsal edge in D are leucophores. Xanthophores and leucophores were severely reduced in number in medaka pax3b−/− mutant hatchlings (leucophores indicated by arrows in A and C; xanthophores, which are autofluorescent and dendritic under UV light, indicated by square brackets in B and D), and were completely absent in medaka pax7a−/− mutants (E,F,H). The number of melanophores was unaltered in pax3b−/− mutants (A,C,G), but were significantly increased in pax7a−/− mutants (E,G). Significant difference was determined by Kruskal–Wallis test. ***P<0.05. n=8 for WT, 10 for pax3b, and 11 for pax7a in G,H. n.s., not significant. Error bars represent s.d.
|
