FIGURE SUMMARY
Title

A gene regulatory network combining Pax3/7, Sox10 and Mitf generates diverse pigment cell types in medaka and zebrafish

Authors
Miyadai, M., Takada, H., Shiraishi, A., Kimura, T., Watakabe, I., Kobayashi, H., Nagao, Y., Naruse, K., Higashijima, S.I., Shimizu, T., Kelsh, R.N., Hibi, M., Hashimoto, H.
Source
Full text @ Development

Expression patterns of pax3 and pax7 in medaka. (A-E″) Expression of pax3b mRNA was detected in NCCs at stage 22 (9 somite embryo) (A-A″, between arrowheads), whereas pax7a expression was observed in migrating NCCs anteroventral to the pax3b-expressing premigratory NCCs (B-B″; panels on the right show enlarged views; pax7a-expressing cells are indicated by arrows). The pax3b expression had shifted posteriorly at stage 25 (18-19 somite embryo) (C,C′, between arrowheads) and became undetectable by stage 27 (24 somite embryo) (not shown). pax7a mRNA was continuously observed in migrating NCCs from stage 25 to stage 27 (indicated by arrows; see also Fig. S2). pax3b and pax7a mRNAs were expressed in similar regions of neural tissue and somites (A-E). Expression of pax3b was observed in several anterior somites at stage 22 (A), shifted to posterior somites at stage 25 (C; see also Fig. S2), and appeared to precede that of pax7a in somites (B,D). The time windows of pax3b and pax7a expression overlapped during stages 22-25. (A-E) Lateral views. (A′-E′,A″,B″,D″,E″) Dorsal views. Images are representative of more than ten embryos. Scale bar: 250 µm.

Phenotypes of medaka pax3 and pax7 mutants. (A-F) Medaka 9 dpf hatchlings. Comparison of pigment cell phenotypes between WT (A,B), pax3b−/− (C,D) and pax7a−/− (lf-2) (E,F). (A,C,E) Dorsal views of the trunk in dark field. (B,D,F) Lateral views of the trunk under UV light. Images are representative of more than ten embryos. Scale bars: 250 µm. (G,H) Quantification of the number of melanophores (G) and leucophores (H) on the dorsal surface of the trunk. Note that leucophores are not always white but often yellow or orange, and have strong fluorescence under UV light. See ‘Microscopy’ in the Materials and Methods section. The highly fluorescent cells in the ventral edge in B and in the dorsal edge in D are leucophores. Xanthophores and leucophores were severely reduced in number in medaka pax3b−/− mutant hatchlings (leucophores indicated by arrows in A and C; xanthophores, which are autofluorescent and dendritic under UV light, indicated by square brackets in B and D), and were completely absent in medaka pax7a−/− mutants (E,F,H). The number of melanophores was unaltered in pax3b−/− mutants (A,C,G), but were significantly increased in pax7a−/− mutants (E,G). Significant difference was determined by Kruskal–Wallis test. ***P<0.05. n=8 for WT, 10 for pax3b, and 11 for pax7a in G,H. n.s., not significant. Error bars represent s.d.

Pigment cell progenitors in medaka pax3b and pax7a mutant embryos. (A-I) Lateral views at top and dorsal views at bottom at stage 29. The gch2-expressing progenitors of xanthophore and leucophore were severely decreased in the pax3b mutant (A,B), with only a few remaining anteriorly, and completely absent in the pax7a mutant (C), which is consistent with the severity of the phenotypes in these mutants at later (hatching) stages. The dct-expressing progenitors of melanophore were slightly decreased in number in pax3b mutant (D,E), but unaltered or even increased in number and expression level in pax7a mutant compared with WT (F). The pnp4a-expressing progenitors of iridophore were not altered in the eyes in both mutants (G-I, bottom left), but the putative progenitors of peritoneum iridophores were decreased in the pax3b mutant (G,H), but not in the pax7a mutant (I, bottom right). Images are representative of more than ten embryos. Scale bar: 250 µm.

pax3 functions upstream of pax7. (A-D) Medaka. (A,B) pax3b expression at stage 21 (6 somite). (C,D) pax7a expression at stage 28 (30 somite). (E-J) Zebrafish. (E,F) pax3a expression at 18 hpf (18 somite). (G,H) pax7a expression at 19.5 hpf (21 somite). (I,J) pax7b expression at 19.5 hpf (21 somite). In medaka, pax3b expression was similar in WT and pax7a mutant embryos (A,B), whereas pax7a expression was largely reduced in NCCs in pax3b mutant embryos compared with WT (C,D). Similarly, in zebrafish, pax3a expression was not altered in pax7a; pax7b double-mutant embryos (E,F), but pax7a and pax7b expression was largely reduced in NCCs in pax3a mutant embryos compared with WT (G-J). Lateral views at top and dorsal views at bottom. Arrowheads indicate the anterior and posterior ends of the expression in the neural crest. Grey and white arrowheads indicate the absence of expression. Images are representative of more than ten embryos. Scale bars: 250 µm.

Loss of pax3 leads to a decrease in mitfa expression. (A-C) Medaka embryos at stage 28 (30 somite). (D-F) Zebrafish embryos at 19.5 hpf (21 somite). Arrowheads indicate the posterior ends of mitfa expression in the neural crest (D-F). Lateral views at top and dorsal views at bottom. The mitfa-expressing cells were largely lost in the absence of Pax3 in medaka (A,B) and in zebrafish (D,E). Those cells appeared to be normal or rather increased in the medaka pax7a mutant (C) and in the zebrafish pax7a; pax7b double mutant (F). Images are representative of more than ten embryos. Scale bars: 250 µm.

Overexpression of pax3a and sox10 induces ectopic expression of mitfa in zebrafish. (A-D′) mitfa expression at 6 hpf in control (A,A′), pax3a synthetic RNA-injected (B,B′), sox10 synthetic RNA injected (C,C′) and pax3a and sox10 synthetic RNA co-injected (D,D′) embryos. (A-D) Lateral views. (A′-D′) Animal pole views. mitfa mRNA was not expressed endogenously in 6 hpf embryo (A). Whereas overexpression of pax3a or sox10 by synthetic RNA injection into 1- to 2-cell-stage embryos failed to induce mitfa expression at 6 hpf, simultaneous overexpression of pax3a and sox10 can induce ectopic expression of mitfa. Scale bars: 200 µm. Fractions were 23/23 for pax3a injection, 16/16 for sox10 injection and 30/38 for pax3a and sox10 co-injection.

Overexpression of mitfa induces ectopic expression of progenitor markers for melanophore and xanthophore. (A-G) dct (A-C) and gch2 (D-G) expression in 6 hpf control (A,D), mitfa synthetic RNA-injected (B,E), mitfa and pax7a synthetic RNA-injected (C,F) and pax7a synthetic RNA-injected (G) embryos. Overexpression of mitfa alone can strongly induce ectopic dct expression (A,B; 22/23). Simultaneous overexpression of pax7a suppresses the ectopic dct expression by mitfa (C; 18/18). Ectopic expression of gch2 mRNA is induced by overexpression of mitfa alone (D,E; 20/24) and more strongly induced by overexpression of mitfa and pax7a in combination (F; 26/31). Overexpression of pax7a alone is unable to induce ectopic gch2 expression (G). Scale bar: 250 µm.

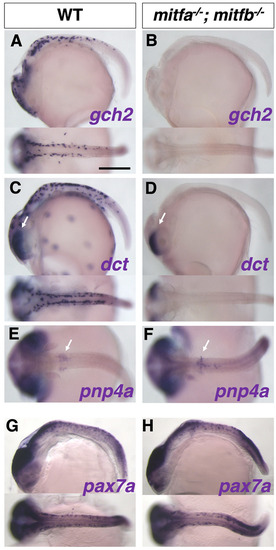
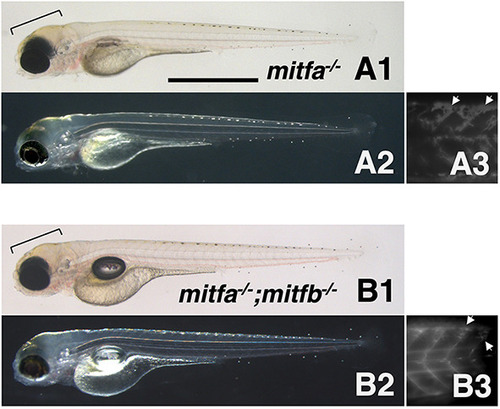
Phenotypes of medaka mitfa and mitfb double homozygotes. (A-O) Phenotypes of wild-type (WT), mitfa single, mitfb single and mitfa and mitfb double mutants in 2 dpf (A-D) and 3 dpf (E-H) embryos, 7 dpf hatchlings (I-K) and 4-month-old adult male (L,M) and female (N,O) fish. (I4,J4,K4) Autofluorescence images showing xanthophores under UV light. (A-H) Upper panels are dorsal views; lower panels are lateral views. (G-K) Panels 1, 2 and 5 are dorsal views; panels 3 and 4 are lateral views. (L-O) Lateral views. Melanophores first appear on the head, the anterior body and the yolk at 2 dpf (A) and increase in number to become distributed throughout the body at 3 dpf (E) in the WT embryo. The mitfa mutant embryo looks normal at this time (B,F), whereas the mitfb mutant does not have melanophores at 2 dpf (C), but shows their delayed formation at 3 dpf (G). The mitfa; mitfb double mutant completely lacks melanophores during this period and thereafter (D,H). At the hatching stage, all the four types of pigment cells are differentiated (pigmented) in WT (I1-I5). The mitfb mutant looks normal except that melanophores are relatively small and few leucophores are found (arrows in J2,J5) compared with those in WT (I1-I5). The mitfa; mitfb double mutant completely lacks not only melanophores (K1,K2,K5) but also xanthophores (K4) and leucophores (K1,K2,K5), but retains iridophores in the eyes and on the yolk (K1,K2,K3). Square brackets indicate xanthophores on the lateral surface of the body (I4,J4). In adulthood, compared with WT (L,M), it is obvious that the mitfa; mitfb double mutant lacks all visible pigmentation except for that of iridophores in the skin and the iris (N,O). Scale bars: 0.5 mm (in A for A-H, in I1 for I1-K1); 5 mm (in L for L-O).

In situ analyses of medaka mitfa−/−; mitfb−/− double mutants with pigment cell markers. Results of in situ analyses with specification markers, dct for melanophore, gch2 for xanthophore/leucophore, and pnp4a for iridophore, are consistent with the phenotypes of differentiated pigment cells. The gch2-expressing xanthophore/leucophore progenitors are lost in the double mutant (A,B). The dct-expressing melanophore progenitors are absent from the body surface, but not from the eyes (retinal pigment epithelium, RPE) in the double-mutant embryo (C,D; arrows indicate the signal in RPE), consistent with the phenotype that the mutant retains melanized RPE (see Fig. 8K1,K3). The pnp4a-expressing iridophore progenitors appear unchanged in the double mutant compared with WT (E,F; arrows indicate the signal on the yolk). The mitfa−/−; mitfb−/− double mutant shows normal expression pattern of pax7a mRNA compared with WT (G,H), suggesting that the defect in xanthophore and leucophore formation in the double mutant is not mediated by Pax7a function. Lateral views at top and dorsal views at bottom. (A-D,G,H) Stage 28. (E,F) Stage 29. Scale bar: 250 µm.

Phenotypes of zebrafish mitfa and mitfb double homozygotes. (A1-B3) 4 dpf mitfa−/− (nacre) hatchling (A1-A3) and 4 dpf mitfa−/−; mitfb−/− hatchling (B1-B3) under normal transmission optics (A1,B1), dark-field epi-illumination optics (A2,B2) and autofluorescence images showing xanthophores under UV light (A3,B3). Yellowish-pigmented xanthophores are observed in the dorsal head of the mitfa−/− hatchling (A1,A2). Autofluorescence emitted by xanthophores is clearly visible in the trunk of mitfa−/− (A3). Similarly, the mitfa−/−; mitfb−/− hatchling has xanthophores in the head (B1,B2) and autofluorescent cells in the trunk (B3). Brackets indicate pigmented xanthophores and arrows indicate autofluorescent (possibly immature) xanthophores. Scale bar: 1 mm.

Model of a gene regulatory network. Our results lead us to postulate a GRN that controls the development of melanophores with Dct expression and xanthophores/leucophores with Gch2 expression. In medaka NCCs, Sox10 (Sox10a and Sox10b in medaka) and Pax3 (Pax3b in medaka) activate Mitf (Mitfa and possibly Mitfb) expression. Mitf can drive transcription of Dct and Gch2. Pax7 represses transcription of Dct by inhibiting Mitf, and promotes transcription of Gch2 cooperatively with Mitf. Pax7 may compensate for loss of Pax3 by activating Mitf expression (dotted line). Expression of Mitf and Pax7 are dependent upon promelanogenic and proxanthogenic/proleucogenic signals, respectively (the cell resides in a tripotent environment). A fraction of the Mitf-expressing cells, if expressing Pax7a (lower cell), would differentiate into the Gch2-expressing xanthophore/leucophore lineage because Mitf and Pax7 cooperatively activate Gch2 expression, whereas Pax7 represses Dct by inhibiting Mitf. Another cell, not expressing Pax7 (upper cell), would differentiate into the Dct-expressing melanophore lineage where Mitf activates Dct expression. Leu, leucophore; Mel, melanophore; Xan, xanthophore.

Acknowledgments
This image is the copyrighted work of the attributed author or publisher, and ZFIN has permission only to display this image to its users. Additional permissions should be obtained from the applicable author or publisher of the image. Full text @ Development