|
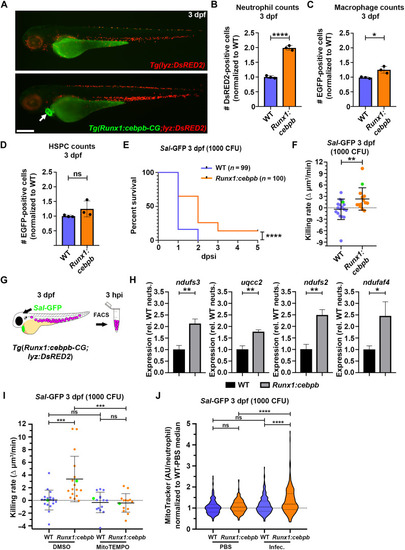
Larvae with cebpb-overexpressing HSPCs demonstrate enhanced granulopoiesis, survival to infection, and have neutrophils with enhanced bactericidal activity and mitochondrial mass. (A) Live imaging of Tg(lyz:DsRED2) and Tg(Runx1:cebpb-CG2;lyzDsRED2) larvae at 3 dpf. (B) Flow quantification of neutrophils from 3 dpf Tg(lyz:DsRED2)/WT and Tg(Runx1:cebpb-CG2;lyzDsRED2) larvae (n = 10 larvae per sample, three experimental replicates). (C) Flow quantification of macrophages from the dissected trunks of 3 dpf Tg(mpeg1:EGFP)/WT and Tg(Runx1:cebpb-CG2;mpeg1:EGFP) larvae (n = 10 larvae per sample, three experimental replicates). (D) Flow quantification of HSPCs from the dissected trunks of 3 dpf Tg(Runx1:EGFP)/WT and Tg(Runx1:cebpb-CG2;Runx1:EGFP) larvae, respectively (n = 25 to 50 larvae per sample, three experimental replicates). (E) Kaplan-Meier graph showing survival of Tg(lyz:DsRED2)/WT and Tg(Runx1:cebpb-CG2;lyzDsRED2) larvae over 5 dpsi with Sal-GFP at 3 dpf. (F) Bacterial killing rates of neutrophils within 3 dpf Tg(lyz:DsRED2)/WT and Tg(Runx1:cebpb-CG2;lyzDsRED2) larvae. Green data points highlight killing rates of neutrophils as shown in fig. S7C. (G) Schematic illustrating strategy to FACS-isolate neutrophils from infected Tg(Runx1:cebpb-CG2;lyzDsRED2) larvae. (H) Expression of ndufs3, uqcc2, ndufs2, and ndufaf4 within neutrophils FACS-isolated from infected Tg(lyzDsRED2)/WT and Tg(Runx1:cebpb-CG2;lyzDsRED2) larvae [as shown in (G)], as detected by qPCR (in biological triplicate). (I) Bacterial killing rates of neutrophils within 3 dpf Tg(lyz:DsRED2)/WT and Tg(Runx1:cebpb-CG2;lyzDsRED2) larvae following MitoTEMPO and DMSO (control) treatment. Green data points highlight killing rates of neutrophils as shown in Fig. S7D. (J) Flow quantification of mitochondrial mass (as measured with MitoTracker relative fluorescence intensity in arbitrary units/neutrophil) within individual neutrophils from Tg(lyz:DsRED2)/WT and Tg(Runx1:cebpb-CG2;lyzDsRED2) larvae following Sal-GFP infection at 3 dpf, compared to PBS-injected controls. Error bars, mean ± SD; *P < 0.05, **P < 0.01, ***P < 0.001, ****P < 0.0001; unpaired Student’s t test (B, C, D, F, and H), Gehan-Breslow-Wilcoxon test (E), and one-way ANOVA with Tukey’s multiple comparisons test (I and J). Scale bar, 250 μm.
|