|
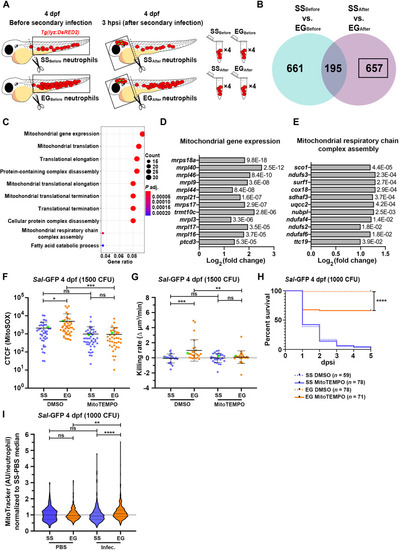
EG neutrophils enhance expression of mitochondria-associated genes following infection, use mtROS for their enhanced bactericidal activity and have greater mitochondrial mass. (A) Schematic illustrating sample collection for RNA-seq of SS and EG neutrophils before (cells harvested from dissected trunks) and after (cells harvested from dissected heads) infection. (B) Venn diagram of DEGs up-regulated in EG neutrophils that were unique to the “SSBefore versus EGBefore” and “SSAfter versus EGAfter” pairwise comparisons and those common to both comparisons. Black box highlights DEGs of interest. (C) GO:BP analysis of DEGs of interest. (D) Log2 fold change of genes associated with the “mitochondrial gene expression” GO term, with adjusted P values. (E) Log2 fold change of genes associated with the “mitochondrial respiratory chain complex assembly” GO term, with adjusted P values. (F) Quantification of mtROS within Sal-GFP-laden SS and EG neutrophils in the presence of MitoTEMPO or DMSO (control), as detected by MitoSOX fluorescence. Green data points highlight mtROS within neutrophils as shown in fig. S5A. (G) Bacterial killing rates of SS and EG neutrophils in the presence of MitoTEMPO or DMSO (control) following Sal-GFP infection. Green data points highlight killing rates of neutrophils as shown in fig. S5B. (H) Kaplan-Meier graph showing survival of DMSO- and MitoTEMPO-treated SS and EG larvae over 5 dpsi with Sal-GFP at 4 dpf. (I) Flow quantification of mitochondrial mass [as measured with MitoTracker relative fluorescence intensity in arbitrary units (AU)/neutrophil] within individual neutrophils from SS and EG larvae, following Sal-GFP infection at 4 dpf, compared to PBS-injected controls. Error bars, mean ± SD; *P < 0.05, **P < 0.01, ***P < 0.001, ****P < 0.0001; one-way ANOVA with Tukey’s multiple comparisons test (F, G, and I) and Gehan-Breslow-Wilcoxon test (H).
|