|
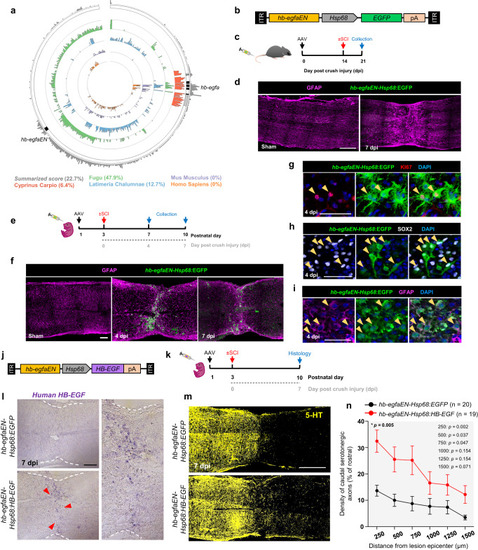
hb-egfaEN directs injury-associated gene expression in neonatal mice and improves axon density through HB-EGF delivery. a Circle plot showing conservation of zebrafish hb-egfaEN in different species. Percentage values indicate conservation scores. Summarized score is the average of the similarity scores of species shown. b Viral construct to evaluate the ability of zebrafish hb-egfaEN to direct expression in mouse spinal cord upon crush injury. c Experimental design to test hb-egfaEN activity in adult mouse spinal cord after systemic delivery of an AAV vector. d Longitudinal sections of spinal cord in sham-injured adult mice and at 1 wpi. e Experimental design to test hb-egfaEN activity in neonatal mouse spinal cord after systemic viral delivery. f Longitudinal sections of neonatal mouse spinal cords, either sham-injured or at 4 or 7 dpi (crush). N = 3. Expression of the marker of cycling Ki67 (g), the transcription factor Sox2 (h), and the glial marker GFAP (i) in cells displaying hb-egfaEN-directed EGFP expression at 4 dpi (crush) in neonatal spinal cord. N = 2. j Viral construct and (k) experimental design to concentrate expression of human HB-EGF at the lesion site of neonatal spinal cords. l In situ hybridization indicating expression of human HB-EGF mRNA at 7 dpi (crush) in mice transduced with AAV carrying hbegfaEN-Hsp68:EGFP (top panel) or hbegfaEN-Hsp68:HB-EGF (bottom panel) constructs. Magnified panel on the right shows site of injury in hbegfaEN-Hsp68:HB-EGF mice. Red arrows indicate HB-EGF mRNA signal. N = 2. m Longitudinal sections of crush-injured spinal cords of neonatal mice at 7 dpi, stained for the marker of serotonergic axons, 5-HT. Sections from 20 hb-egfaEN-Hsp68:EGFP and 19 hbegfaEN-Hsp68:HB-EGF treated mice were analyzed from two independent experiments. Quantification of the density of caudal serotonergic axons at 7 dpi shown in (n). Two-way repeated-measures ANOVA tests with Holm-Šidák correction were used for comparisons. p = 0.005 shown in upper left represents comparisons over all distances. Scale bars 500 μm in (d, m), 200 μm in (l), 100 μm in (f), 50 μm in (g), 40 μm in (h, i). Error bars in (n) indicate SEM. n = number of animals used. Source data are provided as a Source Data file.
|