FIGURE SUMMARY
Title

Spinal cord repair is modulated by the neurogenic factor Hb-egf under direction of a regeneration-associated enhancer

Authors
Cigliola, V., Shoffner, A., Lee, N., Ou, J., Gonzalez, T.J., Hoque, J., Becker, C.J., Han, Y., Shen, G., Faw, T.D., Abd-El-Barr, M.M., Varghese, S., Asokan, A., Poss, K.D.
Source
Full text @ Nat. Commun.

hb-egf genes are induced in zebrafish spinal cord after injury.

a Strategy used to identify regulators of spinal cord regeneration. b, c In situ hybridization for hb-egfa and hb-egfb on longitudinal sections of zebrafish spinal cord at 1 and 2 wpi, and in sham-injured controls. Dashed lines delineate spinal cord. d Sections of spinal cord tissue indicating hb-egfa:EGFP BAC reporter expression (green) in sham, 1 and 2 wpi animals. Acetylated α-Tubulin (red) stains axons. e EdU (red) incorporation assay for cell cycling at 1 wpi in transverse sections of hb-egfa:EGFP spinal cord. f Assays for Sox2 (white) expression at 1 wpi in transverse sections of hb-egfa:EGFP spinal cord. g Cross-section of hb-egfa:EGFP spinal cord at 1 wpi showing hb-egfa expression in ependymoradial-glial cells. GFAP (magenta) stains glial cells. Dashed box is magnified at bottom. h Expression of hb-egfbEGFP in sham injured and injured adult spinal cords at 1 and 2 wpi. i Longitudinal sections of spinal cord indicating expression of Erbb4 receptor (cyan) after sham injury or at 1 wpi. j Transverse sections of adult spinal cord showing expression of egfra mRNA by in situ hybridization after sham injury or at 1 and 2 wpi. N = 3 in (bd) and (gj); N = 2 in (e, f). Asterisks in (j) indicate central canal. Dashed area in (e, f) indicate regions magnified. Scale bars 200 μm in (bd, h, i); 100 μm in (g, j); 50 μm in (e, f). d dorsal, v ventral, r rostral, c caudal.

hb-egfa paralog is required for zebrafish spinal cord regeneration

a Swim capacity of WT (gray) and dKO (red) animals at increasing currents. Data shown as line graphs at increasing timepoints (left) and overlapping violins at each timepoint (right). Two-way repeated-measures ANOVA tests with Holm-Šidák correction. p values for sham groups (left graph, dashed lines) are 0.711 and 0.783 at 2 and 6 weeks, respectively. p < 0.0001 in left panel represents comparison of performance over all timepoints. b Sections of WT and hb-egf dKO cords located rostral or caudal to transection site, after anterograde axon tracing at 4 wpi. Quantification in (c) N = 3. d Tissue sections indicating the glial marker GFAP (magenta) and axonal marker acetylated α-Tubulin (yellow) in WT and hb-egfdKO spinal cords at 4 wpi. Dashed lines delineate tissue bridging. Quantification in (e). N = 4. f Swim capacity assayed of WT (gray), hb-egfa (orange), or hb-egfb (dark red) animals. Data shown as line graphs at increasing timepoints (left) and overlapping violins at each timepoint (right). Two-way repeated-measures ANOVA tests with Holm-Šidák correction. p values for sham groups (left graph, dashed lines) are 0.730 and 0.236 for aKO vs. WT at 2 and 6 weeks, respectively; 0.862 and 0.681 for bKO vs. WT at 2 and 6 weeks, respectively; 0.830 and 0.562 for aKO vs. bKO at 2 and 6 weeks, respectively. p values shown in left graph represent comparison of performance over all timepoints for injured groups. g Sections of WT and hb-egfaKO spinal cords located rostral or caudal to transection site, after anterograde axon tracing at 4 wpi. Quantification in (h). N = 2. i Tissue sections indicating GFAP (magenta) and acetylated α-Tubulin (yellow) in hb-egfaKO or hb-egfbKO spinal cords at 4 wpi. Dashed lines delineate tissue bridging. Quantification in (j). N = 2. Scale bars 200 μm in (d, i), 100 μm in (b, g). Error bars in (a, f) (left graphs) indicate SEM. A two-tailed Mann–Whitney test was used for comparisons in (c, e, h, j). r rostral, c caudal, d dorsal, v ventral. n = number of animals used for the experiments. Source data provided as Source Data file.

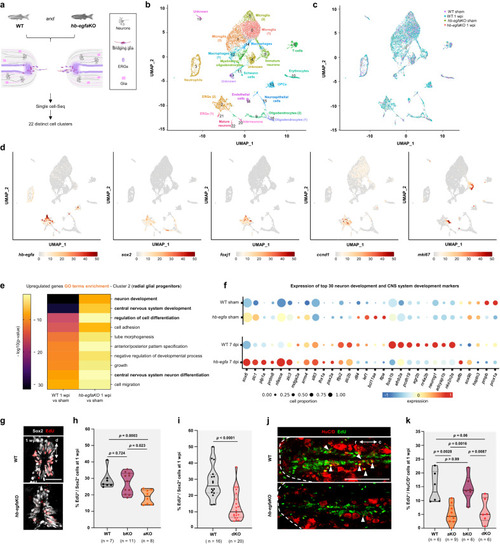
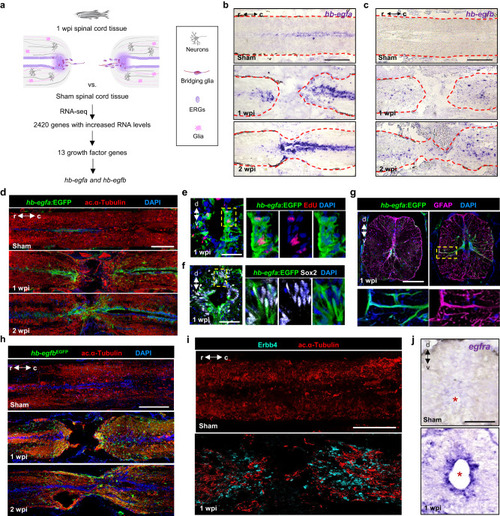
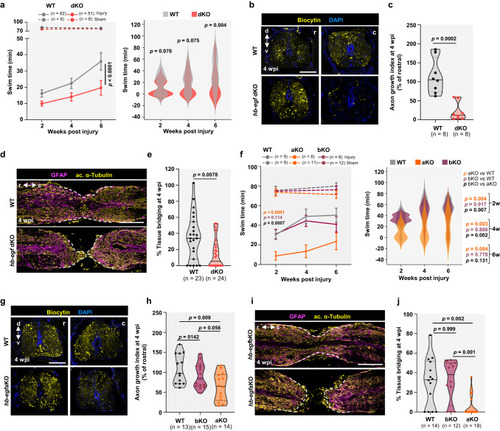
scRNA-seq identifies a role for Hb-egfa in stump neurogenesis during spinal cord repair.

a Diagram with scRNA-Seq strategy. b UMAP showing clustering of scRNA-Seq data at 1 week post injury (wpi). c Cells from sham-injured and 1 wpi wild-type (WT) and hb-egfaKO spinal cords contribute similarly to all identified cell clusters. d Expression of hb-egfa and ERG marker genes in ERGs at 1 wpi. e Heatmap showing enriched GO terms at 1 wpi in radial glial progenitors of WT and hb-egfaKO spinal cords. f Expression of genes involved in neuronal differentiation and central nervous system development identified by GO analyses in WT and hb-egfaKO spinal cords. Dot size represents the percentage of positive cells for each gene, and dot color represents the expression level. Top 30 genes ordered by p value are shown. g Transverse sections of WT and hb-egfaKO spinal cords at 1 wpi, stained for ependymal cells (Sox2+, white) and EdU (red) incorporation. h Quantification of Sox2+ ependymal cell cycling at 1 wpi in WT, hb-egfaKO, or hb-egfbKO fish. N = 2. i Quantification of cycling ependymal cells in WT and hb-egf dKO spinal cords at 1 wpi. N = 3. j Longitudinal sections of WT and hb-egfaKO spinal cords at 1 wpi, stained for the neuronal marker HuC/D (red) and the cycling marker EdU (green). Arrowheads indicate EdU-labeled cells, and dashed line delineates the spinal cord stumps. k Quantification of neurons with EdU labeling in WT, hb-egfaKO, hb-egfbKO and hb-egf dKO cords at 1 wpi. N = 3. Scale bars 50 μm in (g), 200 μm in (j). A two-tailed Mann–Whitney test was used for comparisons in (h, i, k). r rostral, c caudal, d dorsal, v ventral. n = number of animals used for the experiments. Source data are provided as a Source Data file.

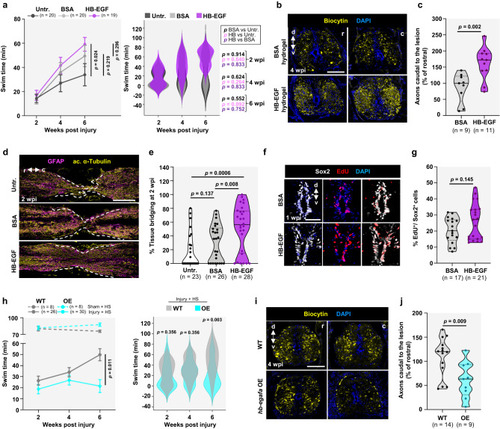
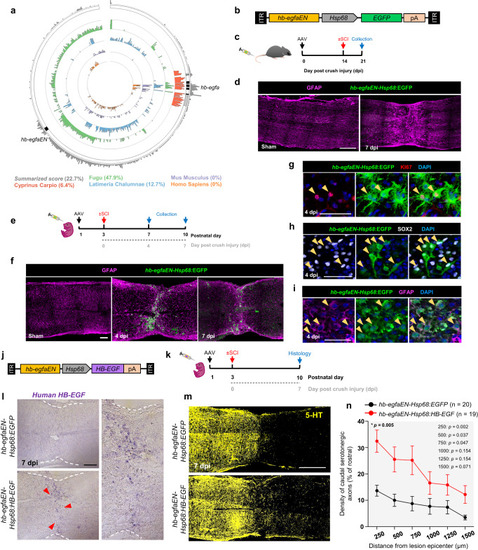
Effects of Hb-egf supplementation on spinal cord regeneration.

a Swim tests in fish treated with HR-HB-EGF hydrogel (purple), BSA hydrogel (gray), or untreated (charcoal gray) at the site of a spinal cord crush injury. Two-way repeated-measures ANOVA tests with Holm-Šidák correction were used for comparisons. b, c Cross sections of BSA- and HR-HB-EGF-hydrogel-treated spinal cords located rostral and caudal to the transection site, after anterograde axon tracing at 4 wpi. Quantification shown in (e). N = 4. A two-tailed unpaired t-test with Welch’s correction was used for comparison. d Longitudinal sections indicating GFAP (magenta) and acetylated α-Tubulin (red) immunofluorescence at 2 wpi in fish treated with BSA- or HR-HB-EGF-loaded hydrogel. Dashed lines delineate sites of tissue bridging. N = 4. e Quantification of tissue bridging. Mann–Whitney tests were used for comparisons. N = 3. f, g Ependymal cell cycling assessed by EdU (red) incorporation in spinal cords of fish treated with vehicle (BSA)- or HR-HB-EGF-loaded hydrogel, shown as transverse sections at 1 wpi. Quantification shown in (c). N = 3. A two-tailed Mann–Whitney test was used for comparisons. h Swim capacity assayed in WT (gray, full line) or hb-egfbOE (cyan, full line) animals at 2, 4 and 6 wpi, and in uninjured animals (dashed lines). Whole-animal hb-egfa overexpression impairs recovery. Two-way repeated-measures ANOVA tests with Holm-Šidák correction were used for comparisons. p values for sham groups in left graph, dashed lines, are p = 0.764 at 2 weeks and p = 0.028 at 6 weeks. p = 0.011 shown in left panel represents comparison of performance over all timepoints. i, j Cross sections of wild-type (WT) and hb-egfaOE spinal cords located rostral or caudal to the transection site, after anterograde axon tracing at 4 wpi. Quantification shown in (h). N = 4. A two-tailed unpaired t-test with Welch’s correction was used for comparison. Scale bars 50 μm in (f), 200 μm in (d), 100 μm in (b, i). Error bars in (a, h) indicate SEM. r rostral, c caudal, d dorsal, v ventral. n = number of animals used for the experiments. Source data are provided as a Source Data file.

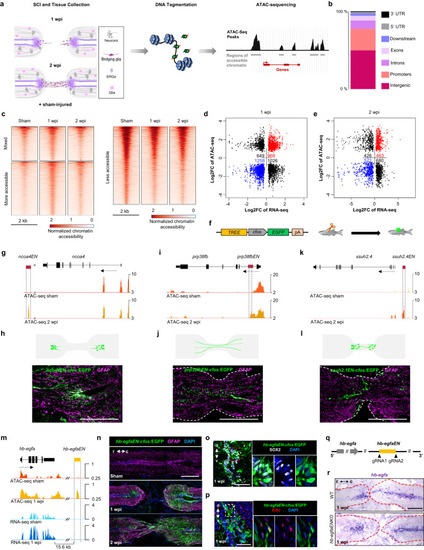
Chromatin profiling reveals an enhancer linked to hb-egfa that directs regeneration-associated gene expression.

a Diagram with strategy used to identify spinal cord TREEs. b Bar plot showing the proportions of dynamic peaks during regeneration located within promoters, exons, introns, and intergenic regions. c Heat map of ATAC-seq signals in sham-injured, 1 and 2 weeks post injury (wpi) spinal cord tissue. Mixed peaks show different trends in 1 and 2 wpi samples, compared with the control. Cutoff is p value < 0.05 and fold change >1.2. Dot plot of differential ATAC-seq chromatin regions linked to nearby differential transcripts at 1 (d) and 2 wpi (e) vs. sham-injured spinal cords. Each point indicates a separate ATAC-seq peak. f Transgene used to assess in vivo TREE function. g, i, k Browser tracks indicating chromatin accessibility (dark and light orange) at the ncoa, prp38fb and ssuh2.4 locus. The candidate ncoa-linked enhancer ncoaEN, prp38fb-linked enhancer prp38fbEN and ssuh2.4-linked enhancer ssuh2.4EN are indicated with dashed lines. h, j, l Cartoon and immunofluorescence images showing injury-induced expression patterns directed by ncoaEN, prp38fb EN and ssuh2.4EN at 2 weeks post injury. m Browser tracks indicating chromatin accessibility (dark and light orange) and transcript levels (light and dark blue) at the hb-egfa locus, indicating the candidate hb-egfa-linked enhancer hb-egfaEN with dashed lines. hb-egfaEN is located 15.6 kb downstream of hb-egfa and increases accessibility during regeneration. n Longitudinal sections of hb-egfaEN-cfos:EGFP spinal cords showing induced EGFP at 1 and 2 wpi. Transverse section images indicating immunofluorescence for Sox2 (o) and EdU incorporation assay for cell cycling (p) in cells displaying hb-egfEN-directed EGFP expression at 1 wpi. q Strategy used to generate hb-egfaEN mutants. r In situ hybridization indicating grossly normal expression of hb-egfa mRNA in spinal cords of wild-type (WT) and hb-egfaEN mutant fish at 1 wpi. N = 2 in (h, j, l); N = 3 in (np, r). Scale bars 200 μm in (h, j, l, n, r), and 50 μm in (o, p). r rostral, c caudal, d dorsal, v ventral.

hb-egfaEN directs injury-associated gene expression in neonatal mice and improves axon density through HB-EGF delivery.

a Circle plot showing conservation of zebrafish hb-egfaEN in different species. Percentage values indicate conservation scores. Summarized score is the average of the similarity scores of species shown. b Viral construct to evaluate the ability of zebrafish hb-egfaEN to direct expression in mouse spinal cord upon crush injury. c Experimental design to test hb-egfaEN activity in adult mouse spinal cord after systemic delivery of an AAV vector. d Longitudinal sections of spinal cord in sham-injured adult mice and at 1 wpi. e Experimental design to test hb-egfaEN activity in neonatal mouse spinal cord after systemic viral delivery. f Longitudinal sections of neonatal mouse spinal cords, either sham-injured or at 4 or 7 dpi (crush). N = 3. Expression of the marker of cycling Ki67 (g), the transcription factor Sox2 (h), and the glial marker GFAP (i) in cells displaying hb-egfaEN-directed EGFP expression at 4 dpi (crush) in neonatal spinal cord. N = 2. j Viral construct and (k) experimental design to concentrate expression of human HB-EGF at the lesion site of neonatal spinal cords. l In situ hybridization indicating expression of human HB-EGF mRNA at 7 dpi (crush) in mice transduced with AAV carrying hbegfaEN-Hsp68:EGFP (top panel) or hbegfaEN-Hsp68:HB-EGF (bottom panel) constructs. Magnified panel on the right shows site of injury in hbegfaEN-Hsp68:HB-EGF mice. Red arrows indicate HB-EGF mRNA signal. N = 2. m Longitudinal sections of crush-injured spinal cords of neonatal mice at 7 dpi, stained for the marker of serotonergic axons, 5-HT. Sections from 20 hb-egfaEN-Hsp68:EGFP and 19 hbegfaEN-Hsp68:HB-EGF treated mice were analyzed from two independent experiments. Quantification of the density of caudal serotonergic axons at 7 dpi shown in (n). Two-way repeated-measures ANOVA tests with Holm-Šidák correction were used for comparisons. p = 0.005 shown in upper left represents comparisons over all distances. Scale bars 500 μm in (d, m), 200 μm in (l), 100 μm in (f), 50 μm in (g), 40 μm in (h, i). Error bars in (n) indicate SEM. n = number of animals used. Source data are provided as a Source Data file.

Acknowledgments
This image is the copyrighted work of the attributed author or publisher, and ZFIN has permission only to display this image to its users. Additional permissions should be obtained from the applicable author or publisher of the image. Full text @ Nat. Commun.