
Fig. 3
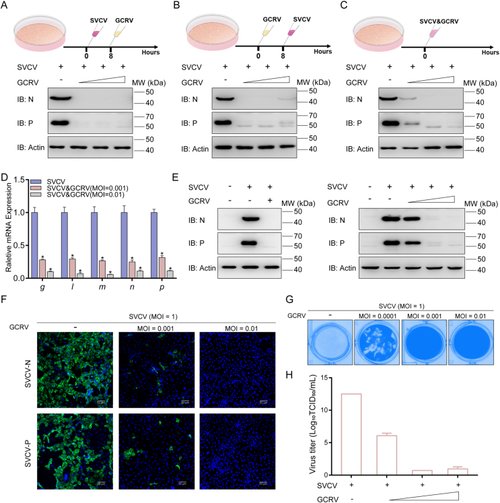
GCRV affects proliferation SVCV in fish cell lines. A–C SVCV is degraded by GCRV in all three different co-infection modes. EPC cells were seeded in 6-well plates overnight and infected with SVCV and GCRV in three modes: SVCV infected and then GCRV infected 8 h later, GCRV infected and then SVCV infected 8 h later, and SVCV and GCRV co-infected at the same time point. After 24 h of subsequent infection, cells were collected for immunoblotting (IB), using the indicated antibodies (Abs). D, E The viral gene transcription and protein expression of SVCV at different titers of GCRV co-infection with SVCV. EPC cells (for IB) were seeded in 6-well plates overnight and co-infected with SVCV (MOI = 1) and GCRV (MOI = 0.01) for 36 h. The total RNAs were extracted to examine the mRNA levels of SVCV genes. The β-actin was used as an internal control for normalization, and the relative expression was represented as fold induction relative to the expression level in control cells (set to 1). Data were expressed as mean ± standard error of the mean (SEM), n = 3. Statistical analysis was performed by the Student's t-test. Asterisks indicate significant differences from control (∗P < 0.05). The expressions of SVCV proteins were determined by IB with the anti-N protein, anti-P protein, and anti-β-actin Abs. F Immunofluorescence (IF) analysis of SVCV proteins at different titers of GCRV co-infection with SVCV. The green fluorescence of N and P proteins were observed under a 20× immersion objective (SP8; Leica). Scale bar, 50 μm. G, H Detection of viral amplification of SVCV at co-infection with different titers of GCRV. EPC cells were seeded in 24-well plates overnight and infected with the indicated concentrations of GCRV (MOI = 0.0001/0.001/0.01) and SVCV (MOI = 1) for 48 h. The cells were fixed with 4% PFA and stained with 1% crystal violet for visualizing CPE, and the viral titers of the supernatants were determined by 50% tissue culture infective dose (TCID50) assays. |