
- Title
-
GCRV NS38 counteracts SVCV proliferation by intracellular antagonization during co-infection
- Authors
- Li, Z.C., Lu, L.F., Zhang, C., Wang, X.L., Tong, J.F., Han, K.J., Chen, D.D., Li, X.Y., Zhou, L., Gui, J.F., Li, S.
- Source
- Full text @ Virol Sin

GCRV blocks the amplification of SVCV in zebrafish. A Survival rates of zebrafish infected with different viruses in combination with SVCV. Adult zebrafish were injected with SVCV [5 × 10⁹ 50% tissue culture infective dose (TCID50)/mL, 5 μL/individual] and GCRV/GCRV-II/CaHV (5 × 10⁷ TCID50/mL, 5 μlLindividual). Mortality recorded over eight days (number of individuals = 15). B Survival rates of zebrafish decreased with combined injection of GCRV and SVCV. Adult zebrafish were injected with PBS only (10 μL/individual), SVCV (5 × 10⁹ TCID50/mL, 5 μL/individual and 5 μL PBS to make up 10 μL/individual), GCRV (5 × 10⁷ TCID50/mL, 5 μL/individual and 5 μL PBS to make up 10 μL/individual), or SVCV&GCRV [(5 × 10⁹ TCID50/mL, 5 μL/individual) for SVCV and (5 × 10⁷ TCID50/mL, 5 μL/individual) for GCRV]. Mortality recorded over eight days (number of individuals = 35). C Microscopy of hematoxylin and eosin (H&E)-stained heart, liver, and spleen sections from male and female zebrafish treated with SVCV (5 × 10⁹ TCID50/mL, 5 μL/individual) or SVCV&GCRV [(5 × 10⁹ TCID50/mL, 5 μL/individual) for SVCV and (5 × 10⁷ TCID50/mL, 5 μL/individual) for GCRV] for 72 h. Histological changes were examined by optical light microscopy for histological changes at ×40 magnification. The location of the pathological area was indicated by white arrows. D Tissue immunofluorescence (IF) of liver, spleen, and heart tissue sections of SVCV infected zebrafish. The green fluorescence of tissue slices was observed with a confocal microscope under a 20× immersion objective (SP8; Leica) and indicates proliferation of SVCV. Scale bar, 10 μm. E Immunoblotting (IB) detection of virus abundance in the tissues of zebrafish in Null, SVCV, and SVCV&GCRV treatment groups. Scale bar, 20 μm. F Transcript levels of SVCV genes in zebrafish tissues of indicated treatment groups. The β-actin gene was used as an internal control and the relative expressions of SVCV genes were represented as fold induction relative to the expression level in control cells (set to 1). Data were expressed as mean ± standard error of the mean (SEM), n = 3. Statistical analysis was performed by the Student's t-test. Asterisks indicate significant differences from control (∗P < 0.05). |

The effect of SVCV on zebrafish gene transcription is eliminated by GCRV. A Schematic representation of zebrafish tissue dissection and RNA extraction for transcriptome sequencing. The liver and spleen tissues from male and female zebrafish injected with PBS (10 μL/individual), SVCV [5 × 10⁹ 50% tissue culture infective dose (TCID50)/mL, 5 μL/individual and 5 μL PBS to make up 10 μL/individual] and SVCV&GCRV (5 × 10⁷ TCID50/mL, 5 μL/individual) for 72 h. Total RNAs were extracted and used for transcriptome sequencing and analysis. B Heat maps of representative gene modules of STEM analysis in different tissues. The P-values were corrected for the False Discovery Rate (FDR) method, and modules with P-values less than 0.05 were selected as significant. C Quantitative PCR (qPCR) validates changes in representative genes of immune system. The β-actin gene was used as an internal control, and the relative expressions of ifn and irf3 genes were represented as fold induction relative to the expression level in control cells (set to 1). Data were expressed as mean ± standard error of the mean (SEM), n = 3. Statistical analysis was performed by the Student's t-test. Asterisks indicate significant differences from control (∗P < 0.05). D GSEA enrichment plots in SVCV versus Null and SVCV&GCRV versus SVCV groups. E Rose plots showing the number of DEGs at SVCV versus Null and at SVCV&GCRV versus SVCV in selected pathways (FC > 1.5, adjusted P < 0.05). |
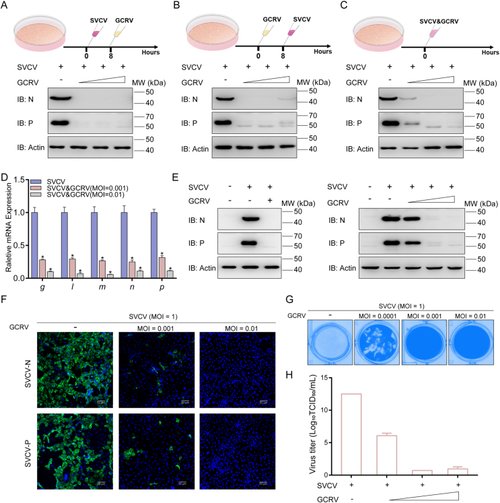
GCRV affects proliferation SVCV in fish cell lines. A–C SVCV is degraded by GCRV in all three different co-infection modes. EPC cells were seeded in 6-well plates overnight and infected with SVCV and GCRV in three modes: SVCV infected and then GCRV infected 8 h later, GCRV infected and then SVCV infected 8 h later, and SVCV and GCRV co-infected at the same time point. After 24 h of subsequent infection, cells were collected for immunoblotting (IB), using the indicated antibodies (Abs). D, E The viral gene transcription and protein expression of SVCV at different titers of GCRV co-infection with SVCV. EPC cells (for IB) were seeded in 6-well plates overnight and co-infected with SVCV (MOI = 1) and GCRV (MOI = 0.01) for 36 h. The total RNAs were extracted to examine the mRNA levels of SVCV genes. The β-actin was used as an internal control for normalization, and the relative expression was represented as fold induction relative to the expression level in control cells (set to 1). Data were expressed as mean ± standard error of the mean (SEM), n = 3. Statistical analysis was performed by the Student's t-test. Asterisks indicate significant differences from control (∗P < 0.05). The expressions of SVCV proteins were determined by IB with the anti-N protein, anti-P protein, and anti-β-actin Abs. F Immunofluorescence (IF) analysis of SVCV proteins at different titers of GCRV co-infection with SVCV. The green fluorescence of N and P proteins were observed under a 20× immersion objective (SP8; Leica). Scale bar, 50 μm. G, H Detection of viral amplification of SVCV at co-infection with different titers of GCRV. EPC cells were seeded in 24-well plates overnight and infected with the indicated concentrations of GCRV (MOI = 0.0001/0.001/0.01) and SVCV (MOI = 1) for 48 h. The cells were fixed with 4% PFA and stained with 1% crystal violet for visualizing CPE, and the viral titers of the supernatants were determined by 50% tissue culture infective dose (TCID50) assays. |

The NS38, S9 segment-encoded protein of GCRV, inhibits SVCV proliferation. A, B Effect of overexpression of GCRV segments on the SVCV proliferation. EPC cells were seeded in 6-well plates and transfected with indicated plasmids (1 μg each) for 24 h, then cells were infected with SVCV (MOI = 1) for 24 h prior to being harvested for RNA extraction and quantitative PCR (qPCR). The β-actin was used as an internal control for normalization. The relative expressions of SVCV genes were represented as fold induction relative to the expression level in control cells (set to 1). Data were expressed as mean ± standard error of the mean (SEM), n = 3. Statistical analysis was performed by the Student's t-test. Asterisks indicate significant differences from control (∗P < 0.05). The expressions of SVCV proteins were determined by immunoblotting (IB) with the anti-N protein, anti-P protein, and anti-β-actin antibodies (Abs). C, D Detection of the viral titer of SVCV effected by overexpression of NS38. EPC cells were seeded in 24-well plates overnight and transfected with 2 μg NS38-Myc or vector. After 24 h, cells were infected with SVCV (MOI = 1) for 48 h. The cells were fixed with 4% PFA and stained with 1% crystal violet for visualizing cellular cytopathic effect (CPE) (C), and the viral titers of the supernatants were determined by 50% tissue culture infective dose (TCID50) assays (D). E NS38 degrades SVCV on a dose-dependent manner. EPC cells were seeded in 6-well plates and transfected with 0.5, 1, 1.5, or 2.0 μg NS38-Myc or empty vector for 24 h, then cells were infected with SVCV (MOI = 1) for 24 h prior to being harvested for IB analysis of WCLs with the indicated Abs. F–I NS38 inhibits proliferation SVCV. Immunofluorescence (IF) analysis was used to indicate amplification of SVCV, with green fluorescence representing the N protein (F). The mRNA levels of SVCV genes were detected upon overexpression and knockdown of S9 (G, I). H Transcript levels of S9 tested the efficiency of knockdown. Data were expressed as mean ± SEM, n = 3. Statistical analysis was performed by the Student's t-test. Asterisks indicate significant differences from control (∗P < 0.05). |

NS38 associates with and degrades N and P proteins. A NS38 localizes in the cytoplasm. EPC cells were plated onto coverslips in 6-well plates and transfected with indicated plasmids (1 μg each). After 24 h, the cells were fixed and subjected for confocal microscopy analysis. Scale bar, 5 μm. B, C NS38 associates with N and P proteins. EPC cells seeded in 10-cm2 dishes overnight were transfected with the indicated plasmids (5 μg each). After 24 h, cell lysates were immunoprecipitated (IP) with anti-Myc/Flag affinity gels. Then, the immunoprecipitates and cell lysates were analyzed by immunoblotting (IB) with indicated antibodies (Abs). D–F NS38 degrades N and P proteins and barely affects G protein expression. EPC cells were plated onto coverslips in 6-well plates and transfected with indicated plasmids (1 μg each). After 24 h, the cells were fixed and subjected for confocal microscopy analysis. Green or red signals represent overexpressed N, P, and G proteins (original magnification 10×; non-immersion objective). Scale bar, 300 μm. The fluorescence intensity (arbitrary unit, a.u.) was recorded by the LAS X software, and the data were expressed as mean ± SD, n = 5. Statistical analysis was performed by the Student's t-test. Asterisks indicate significant differences from control (∗P < 0.05). IB with indicated Abs was used to detect the expression level of N/P/G proteins. G–I NS38 degrades N and P proteins on a dose-dependent manner. EPC cells were seeded in 6-well plates and transfected with 1 μg N-Flag or P-Flag and 1 μg NS38-Myc (G) or 0.5, 1.0, or 1.5 μg NS38-Myc (H, I). At 24 h post-transfection, the cells were harvested for IB with the indicated Abs. |

NS38 degrades N proteins in an autophagy-dependent manner. A Inhibitors of autophagy progress block NS38-mediated degradation of N protein. EPC cells were seeded in 6-well plates overnight and co-transfected the indicated plasmids (1 μg each). At 18 h post-transfection, the cells were treated with DMSO, MG132 (20 μmol/L), 3-MA (2 mmol/L), Baf-A1 (100 nmol/L), or CQ (100 μmol/L) for 6 h. The cell lysates were subjected to immunoblotting (IB) with the indicated antibodies (Abs). B–D The NS38-induced N protein degradation is rescued by 3-MA, Baf-A1, and CQ on a dose-dependent manner. EPC cells were seeded in 6-well plates overnight and co-transfected with the indicated plasmids. At 18 h post-transfection, the cells were treated with 3-MA (1 or 2 mmol/L), Baf-A1 (50 or 100 nmol/L) or CQ (50 or 100 μmol/L) for 6 h. Then, the cells were harvested for IB with the indicated Abs. E, F The presence of NS38 or N-only does not affect autophagy flux. EPC cells were seeded in 6-well plates and transfected with N-Myc or NS38-HA (0.5, 1, or 1.5 μg). At 18 h post-transfection, the cells were treated with DMSO or Baf-A1 (100 nmol/L) for 6 h. Then, the cells were harvested for IB with the indicated Abs. G, H Co-expression of NS38 and N protein specifically activates autophagy. EPC cells were seeded in 6-well plates overnight and co-transfected the indicated plasmids (1 μg each). At 18 h post-transfection, the cells were treated with DMSO, 3-MA (2 mmol/L), Baf-A1 (100 nmol/L), or CQ (100 μmol/L) for 6 h. The cell lysates were subjected to IB with the anti-LC3, anti-Myc, anti-HA and anti-β-actin Abs, respectively. EBSS was used to exclude the effect of non-specific cellular autophagy activation on N protein expression. I–L Co-expression of NS38 and N protein induces aggregation of LC3. EPC cells were plated onto coverslips in 6-well plates and co-transfected with 1 μg pCS2-mCherry, NS38-mCherry, or N-mCherry plus 1 μg LC3-GFP. After 24 h, the cells were fixed and observed by confocal microscopy. Red signals represent overexpressed NS38 or N protein, green signals represent overexpressed LC3 (original magnification 63×; oil immersion objective). Scale bar, 5 μm. K The percentage of cells in which LC3 aggregates (J) was quantified under a 20× immersion objective (SP8; Leica) and data were expressed as mean ± SD, n = 3. Statistical analysis was performed by the Student's t-test. Asterisks indicate significant differences from control (∗P < 0.05). M Autophagosome-like structures detection by transmission electron microscopy (TEM). EPC cells were seeded in 6-well plates overnight and transfected with indicated plasmids (1 μg each) for 24 h. The cells were then analyzed by TEM, enlarged section indicating autophagic vesicles. Scale bar, 2 or 0.4 μm. |

NS38 manipulates p62 to degrade N protein and affects biological function of N protein. A, B NS38 associates with autophagy receptor p62. EPC cells seeded in 10-cm2 dishes overnight were transfected with the indicated plasmids (5 μg each). After 24 h, cell lysates were immunoprecipitated (IP) with anti-Flag affinity gels or anti-HA affinity gels. Then, the immunoprecipitates and cell lysates were analyzed by immunoblotting (IB) with anti-Flag, anti-Myc and anti-HA antibodies (Abs), respectively. C, D The p62 is essential for NS38 degradation of N protein. Overexpression of p62 promotes the degradation of N protein by NS38 (C). EPC cells were seeded in 6-well plates overnight and co-transfected the indicated plasmids. After 24 h, the cell lysates were subjected to IB with indicated Abs. Knockdown of p62 eliminates the degradation of N protein by NS38 (D). EPC cells were seeded in 6-well plates overnight and transfected with 2 μg shp62#1-pLKO.1, shp62#2-pLKO.1 or the negative control (sh-NC) with other indicated plasmids for 24 h. The cell lysates were then subjected to IB with indicated Abs. |

NS38 degrades P protein via the ubiquitin-proteasome pathway and inhibits its biological function. A, B MG132 blocks NS38-mediated degradation of P protein. EPC cells were seeded in 6-well plates overnight and co-transfected the indicated plasmids (1 μg each). At 18 h post-transfection, the cells were treated with DMSO, MG132 (20 μmol/L or a dose gradient of 10 μmol/L, 20 μmol/L), 3-MA (2 mmol/L), Baf-A1 (100 nmol/L), or CQ (100 μmol/L) for 6 h. The cell lysates were subjected to immunoblotting (IB) with the indicated antibodies (Abs). C, D NS38 reduces the ubiquitination of P protein through inhibiting K63-linked endogenous ubiquitination of P protein. EPC cells were transfected with 5 μg P-Myc, 5 μg NS38-Flag or empty vector, and 1 μg Ub-HA, Ub-K48O-HA or Ub-K63O-HA. At 18 h post-transfection, the cells were treated with MG132 (20 μmol/L) for 6 h. At 24 h post-transfection, cell lysates were immunoprecipitated (IP) with anti-Myc affinity gel. Then the immunoprecipitates and WCLs were analyzed by IB with the indicated Abs. |
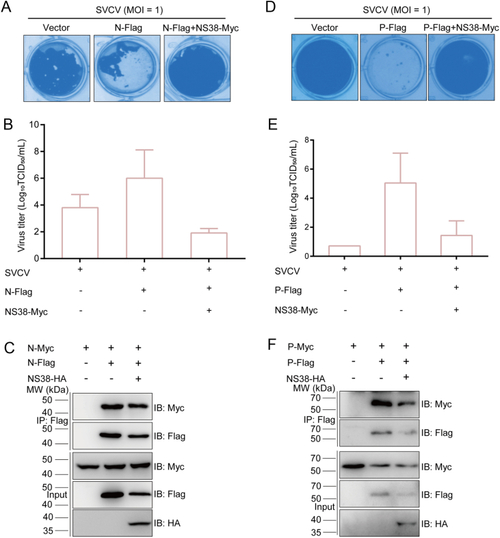
NS38 inhibits the biological functions of N and P proteins. A, B, D, E The effect of N/P on promoting SVCV amplification is attenuated by NS38. EPC cells were seeded in 24-well plates overnight and transfected with indicated plasmids (0.25 μg each) for 24 h, and were then infected with SVCV (MOI = 1). The viral titers of the supernatants were determined by 50% tissue culture infective dose (TCID50) assays. C, F N/P proteins dimerization is attenuated by NS38. EPC cells seeded in 10-cm2 dishes overnight were transfected with the indicated plasmids (5 μg each). After 24 h, cell lysates were immunoprecipitated (IP) with anti-Flag affinity gels. Then, the immunoprecipitates and cell lysates were analyzed by immunoblotting (IB) with indicated antibodies. |